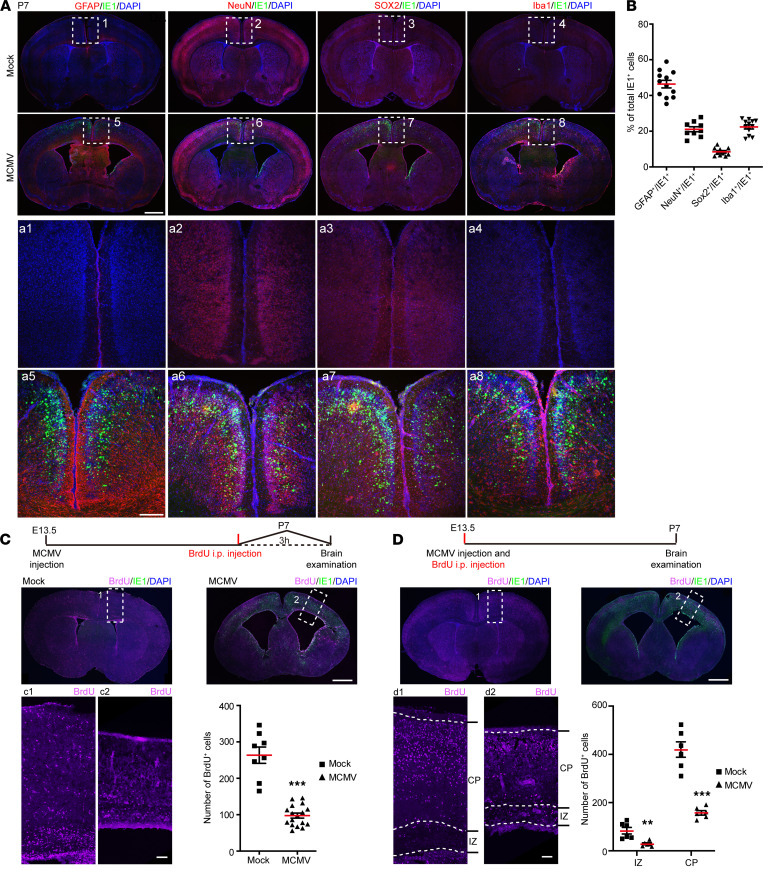
Figure 5. cMCMV infection of brain resident cells and impaired NPC proliferation and migration.
(A) Localization of IE1 and brain cell markers. Coronal brain sections were stained by immunofluorescence assay (IFA) for IE1 (green), DAPI (blue), or GFAP (red), NeuN (red), SOX2 (red), or Iba1 (red), respectively. Position-matched cortex regions (indicated by white dashed box) are shown in magnified views. (B) Percentage of different cell types in IE1+ cells. Among the IE1+ cells, the proportions of GFAP+IE1+, NeuN+IE1+, SOX2+IE1+, or Iba1+IE1+ cells in position-matched cortex were quantified separately. (C) NPCs’ proliferation at P7. BrdU was administrated i.p. to newborns at P7, and the brains were harvested 3 hours later. Coronal brain sections were stained for BrdU (purple), IE1 (green), or DAPI (blue). BrdU+ cells in position-matched cortex (indicated by white dashed rectangle) in each group were quantified. (D) NPCs’ migration at P7. BrdU was administrated i.p. to pregnant mice at E13.5, and neonatal brains from offspring were harvested at P7. Coronal brain sections were stained for BrdU (purple), IE1 (green), or DAPI (blue). BrdU+ cells in position-matched IZ and CP (indicated by white dashed rectangle) were quantified. Data were collected from 3–9 newborns/group in 3 independent experiments and analyzed by 2-tailed Student’s t test. **, P <0.01; ***, P < 0.001. Scale bar: 1 mm (A, top); 200 μm (A, bottom); 100 μm (C and D).

