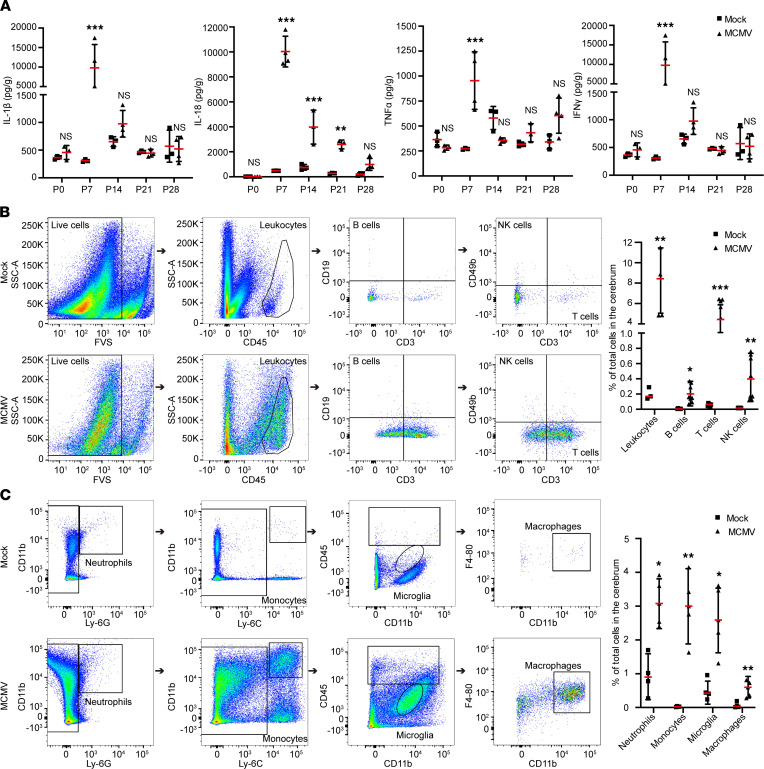
Figure 6. Neuroinflammation induced by cMCMV infection.
(A) Dynamic changes of cytokine levels in cerebrum of infected mice. Levels of IL-1β, IL-18, TNF-α, and IFN-γ in cerebral samples at the indicated time points were determined by ELISA from 3–6 newborns/group in 3 independent experiments. (B) Representative flow cytometric plots of B (CD45+CD19+), T (CD45+CD3+), and NK cells (CD45+CD3–CD49b+) among total cells in the cerebrum at P7 are shown. Percentages of leukocytes and B, T, and NK cells in total cells in the cerebrum were calculated from 12 newborns/group. (C) Neutrophils, monocytes, microglia, and macrophage infiltration in cerebra at P7. Representative flow cytometric plots separating neutrophils (CD11b+Ly-6G+), monocytes (CD11b+Ly-6C+), microglia (CD45–CD11bdim), and macrophages (CD45+CD11b+F4-80+) among total cells in the cerebrum are shown. Percentages of neutrophils, monocytes, microglia, and macrophages among total cells in the cerebrum were calculated from 12 newborns/group. Data were analyzed by 2-tailed Student’s t test and results are presented as means ± SEMs. *P < 0.05; **P < 0.01; ***P < 0.001.

