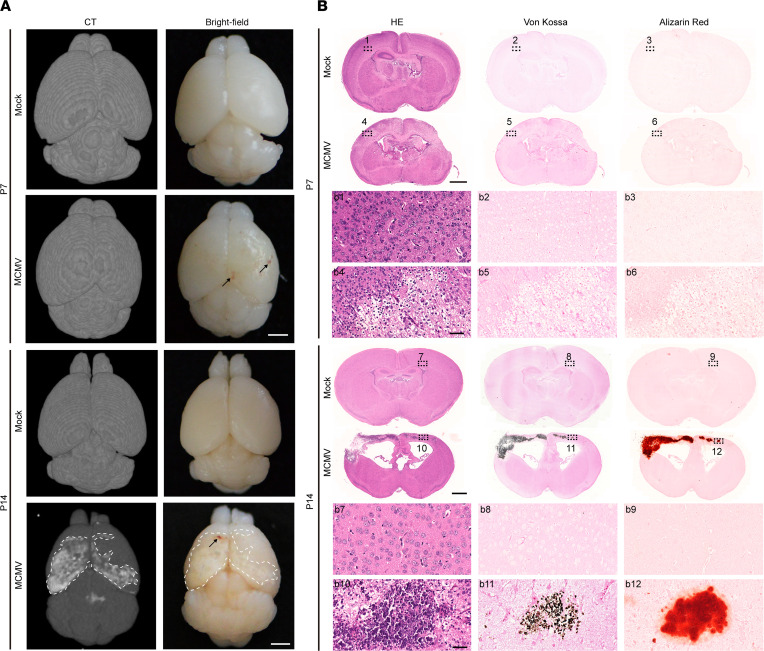
Figure 8. CT neuroimaging abnormalities and brain calcification induced by cMCMV infection.
(A) Neuroimaging by CT. Neuroimaging by micro-CT was applied to assess brain damage at P7 and P14. Axial views of mock- and MCMV-infected neonatal brains were obtained by bright-field microscopy or micro-CT. Representative images are shown with cerebral calcification area outlined by white dashed lines. Hemorrhage is indicated by black arrows. Scale bar: 2 mm. (B) Cerebral calcification assessed by IHC at P7 and P14. Position-matched adjacent sequential coronal cerebral sections of mock- and MCMV-infected brains were subjected to HE staining for brain architecture and von Kossa and Alizarin red staining for calcium deposition. Position-matched regions in the sections are shown in magnified views (indicated by black dashed rectangles). Scale bar: 1 mm; 50 μm (magnified images).

