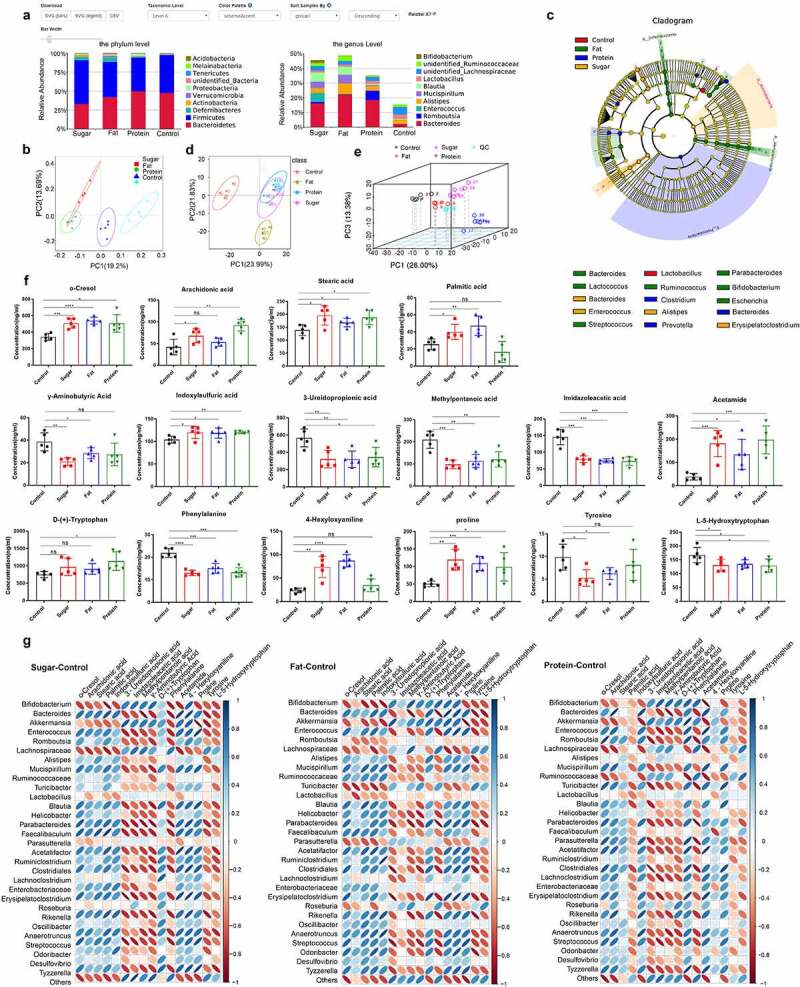
Figure 1.

The intestinal microbiota and its metabolites shaped by different diets. The relative abundance of species at the phylum and genus levels (excluding others) of the four dietary groups (a). The intestinal microbiota of the four groups was analyzed by unweighted UniFrac distance principal coordinate analysis (PCoA) (b). In the LEfSe cladogram, the inner to outer radiating circles represent the taxonomic level from phylum to genus, and the diameter of small circles is proportional to the relative abundance. Species with no significant differences are uniformly colored yellow, and species with differences are colored with the biomarker group (c). Principal component analysis (PCA) of metabolomics data for the four dietary groups (d) and multivariate PCA of the top three principal components (e). Differential metabolites related to inflammation in each diet group (f). Thermogram analysis of the correlation between different bacteria and different metabolites; Blue indicates a positive correlation and red indicates a negative correlation (g).
