
Figure 2.
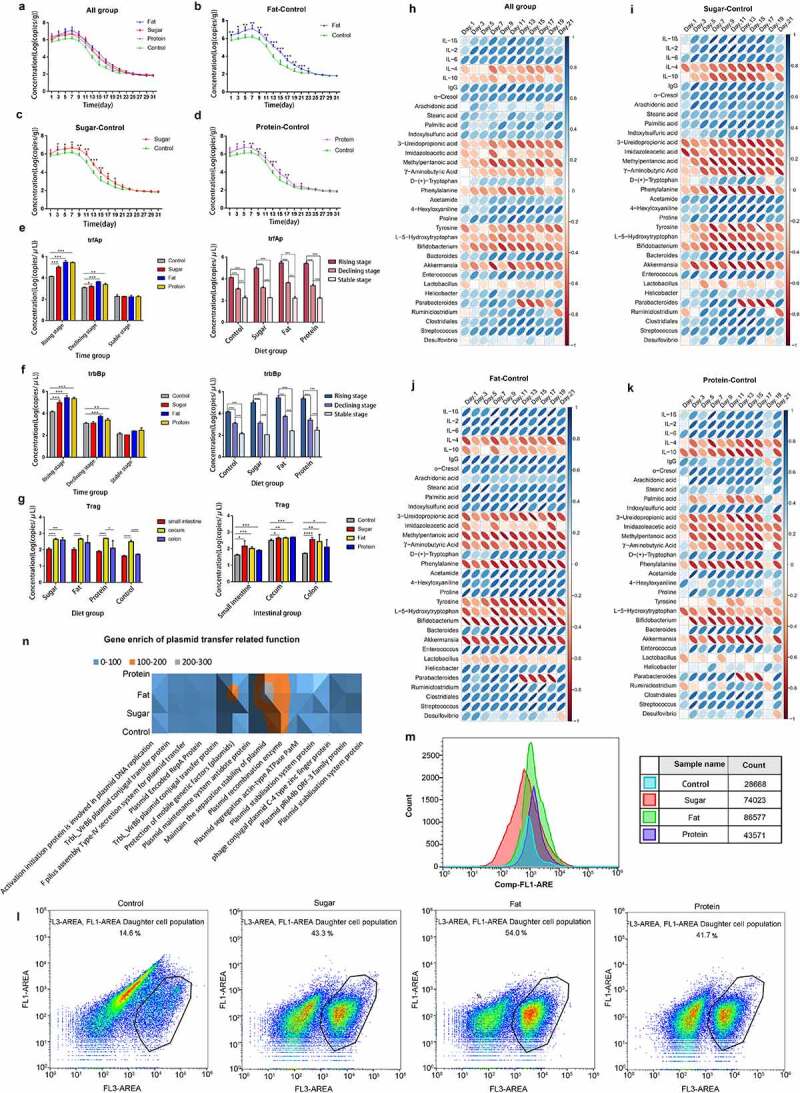
Distribution and mechanisms of ARGs in different diets. Temporal distribution of ARGs in different diet groups (a); 1–7 days is the rising stage, and ARB were administered by gavage every day at this stage; 9–21 days is the declining stage, and the stable stage began 23 days later. The figure shows the difference in time distribution between each of the three diet groups and the control group (b–d). Expression levels of ARG conjugation transfer regulatory genes (e, f). The distributions are shown for two regulatory genes promoting the conjugation and transfer of ARGs in the three stages for the four dietary groups. The spatial distributions of ARGs in different dietary groups are shown for the small intestine, cecum, and colon (g). Pearson correlation analysis of ARG amplification and transfer (distribution level at each time point) with inflammation-related indicators (serum immune factors and inflammation-related metabolites) for all diet groups (h) and for high-sugar, high-fat, and high-protein groups shown as a heatmap. Blue indicates a positive correlation and red indicates a negative correlation, and the darker the color, the stronger the correlation (i–k). Scatter plot of cell membrane-damaged bacteria bound to PI dye (l). Fluorescence intensity of bacteria combined with DCFH-DA (m).The total amount of gene enrichment in plasmid transfer-related pathways for each diet group, the abundance is represented by gray, Orange and blue from high to low (n).