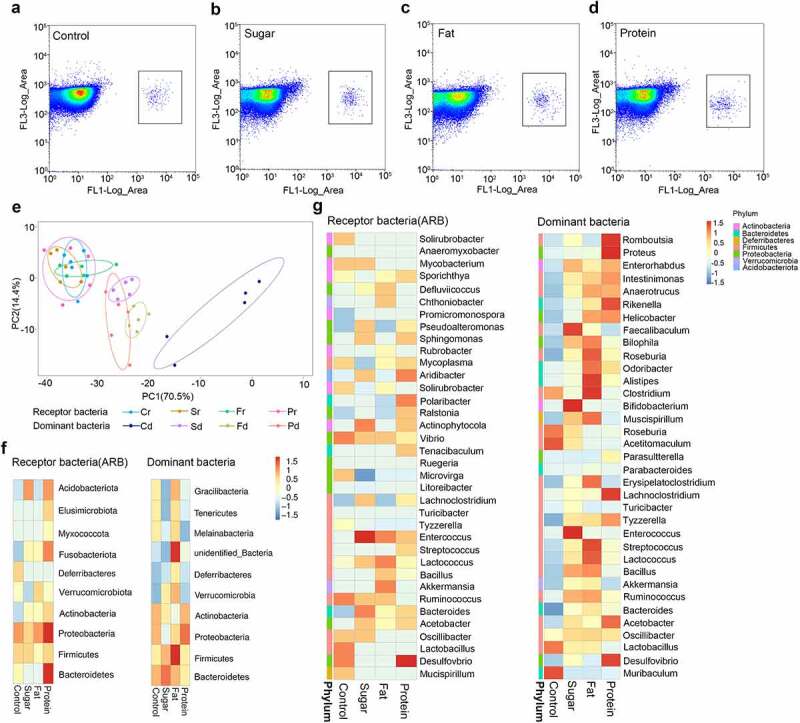
Figure 3.

The distribution of receptor species in different diet groups. Flow cytometry was used to select receptor bacteria with green fluorescence, and positive bacteria were collected in a small square frame (a–d). PCA of receptor bacteria (diet-r) and dominant bacteria (diet-d) for the four dietary groups analyzed by unweighted UniFrac distance (e). Top 10 species distribution heatmap at the phylum level for receptor bacteria and dominant bacteria in each diet group (f). Top 35 species distribution heatmap at the genus level for receptor bacteria and dominant bacteria in each diet group, different colors on the left of the heatmap indicate the phylum to which each genus belongs (g).
