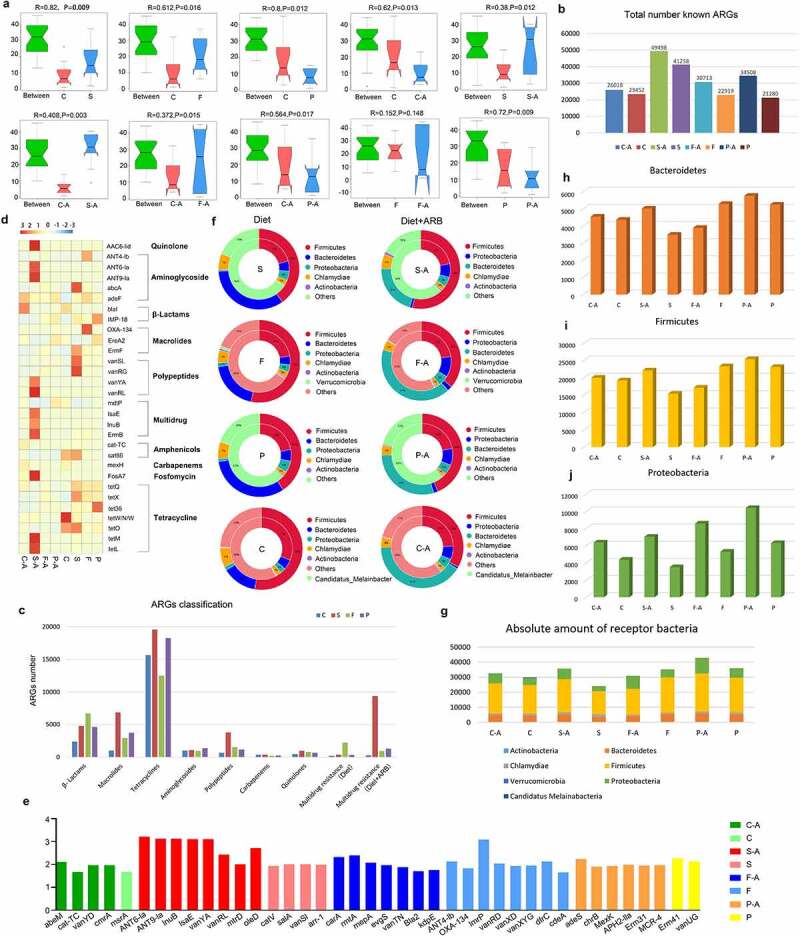
Figure 4.

Intestinal resistance gene annotation in different diet groups. Anosim analysis based on the abundance of ARGs in each diet group with and without added ARB (a). Histogram of the total number of ARGs in each group (b). Classification histogram of ARGs in each group (c). Cluster heatmap of the distribution and relative abundance of ARGs in each group (d). Histogram of ARG markers before and after adding ARB in each diet group (e). Double circle diagram of the proportion of ARGs distributed among species. The inner circle is the distribution of species containing ARGs, and the outer circle is the distribution of species with all genes (f). Absolute number of different bacteria containing ARGs in each group (g–i).
