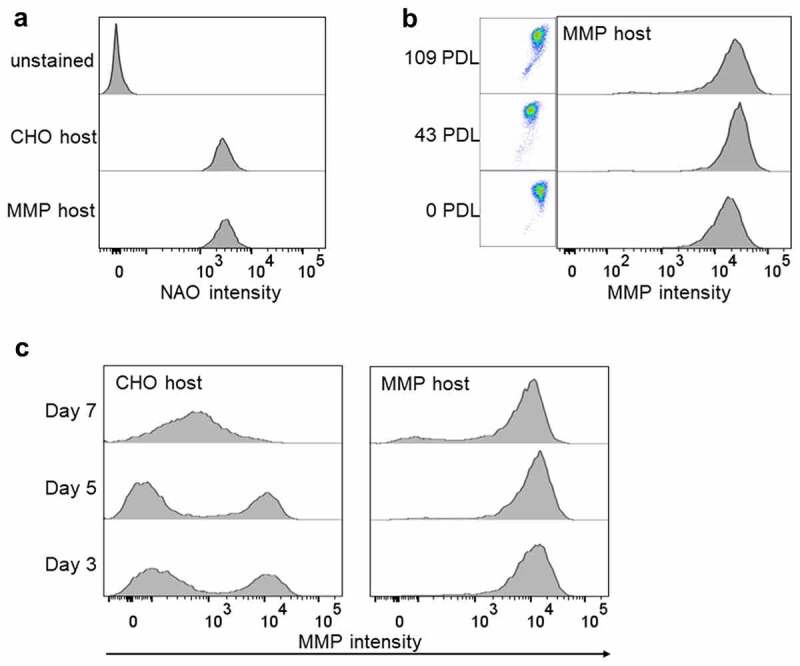
Figure 2.

Phenotype of MMP-enriched host. (a) Histogram plots of mitochondrial mass determined by nonyl acridine orange (NAO) staining followed by flow cytometric analysis. (b) Flow cytometric analysis of the stability of the MMP trait of the MMP-enriched host over generations. Bivariate plots of green (x-axis) versus orange fluorescence (y-axis) and univariate histogram plots of orange fluorescence depicting Mito-ID dye staining pattern. PDL: Population doubling level. (c) Flow cytometric analysis of the MMP trait of the parental CHO and MMP-enriched hosts on days 3 (PDL 10 for CHO and 11 for MMP), 5 (PDL 12 for CHO and 14 for MMP) and 7 (PDL 14 for CHO and 16 for MMP) following subculture. Flow cytometric analyses of mitochondrial mass of parental CHO and MMP-enriched hosts and stability of the high MMP trait of MMP host cells over 109 generations and following subculture.
