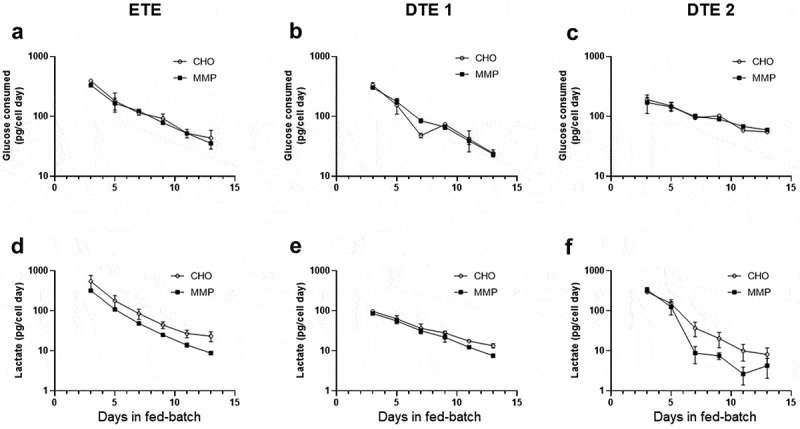
Figure 4.

Metabolic profile of pools expressing ETE, DTE1 and DTE2 in fed-batch cultures. (a–c) Glucose consumption, (d–f) lactate production. Data represent mean ± SD (n = 4). Glucose consumption and lactate production of the pools in fed-batch culture showing reduced lactate production by the MMP host-derived pools.
