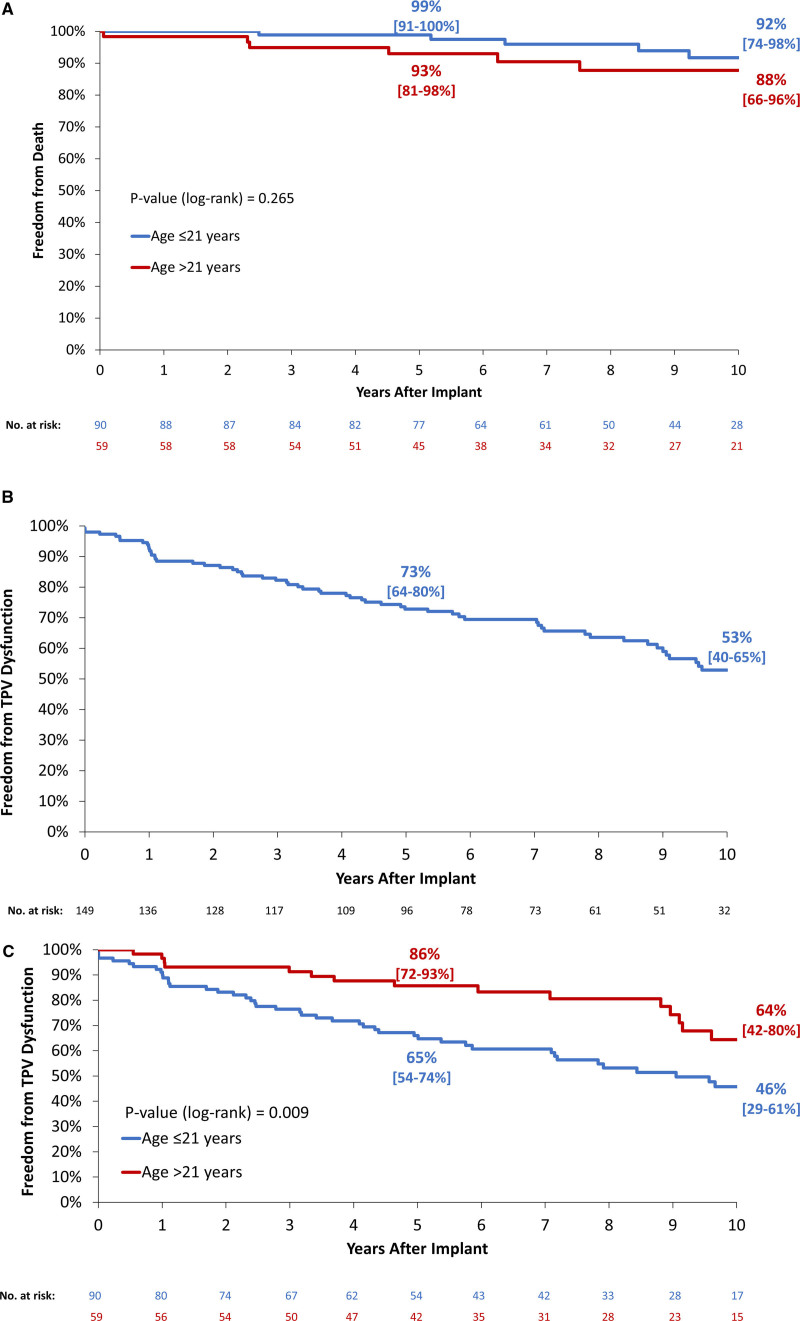
Figure 2.
Survival and transcatheter pulmonary valve (TPV) dysfunction. Kaplan-Meier curves depict (A) estimated freedom from all-cause death by age (≤21 vs >21 y), and freedom from TPV dysfunction, (B) overall, and (C) by age (≤21 vs >21 y). Estimates displayed with (95% CI). End point evaluated in patients implanted >24 h.

