
FIG 5.
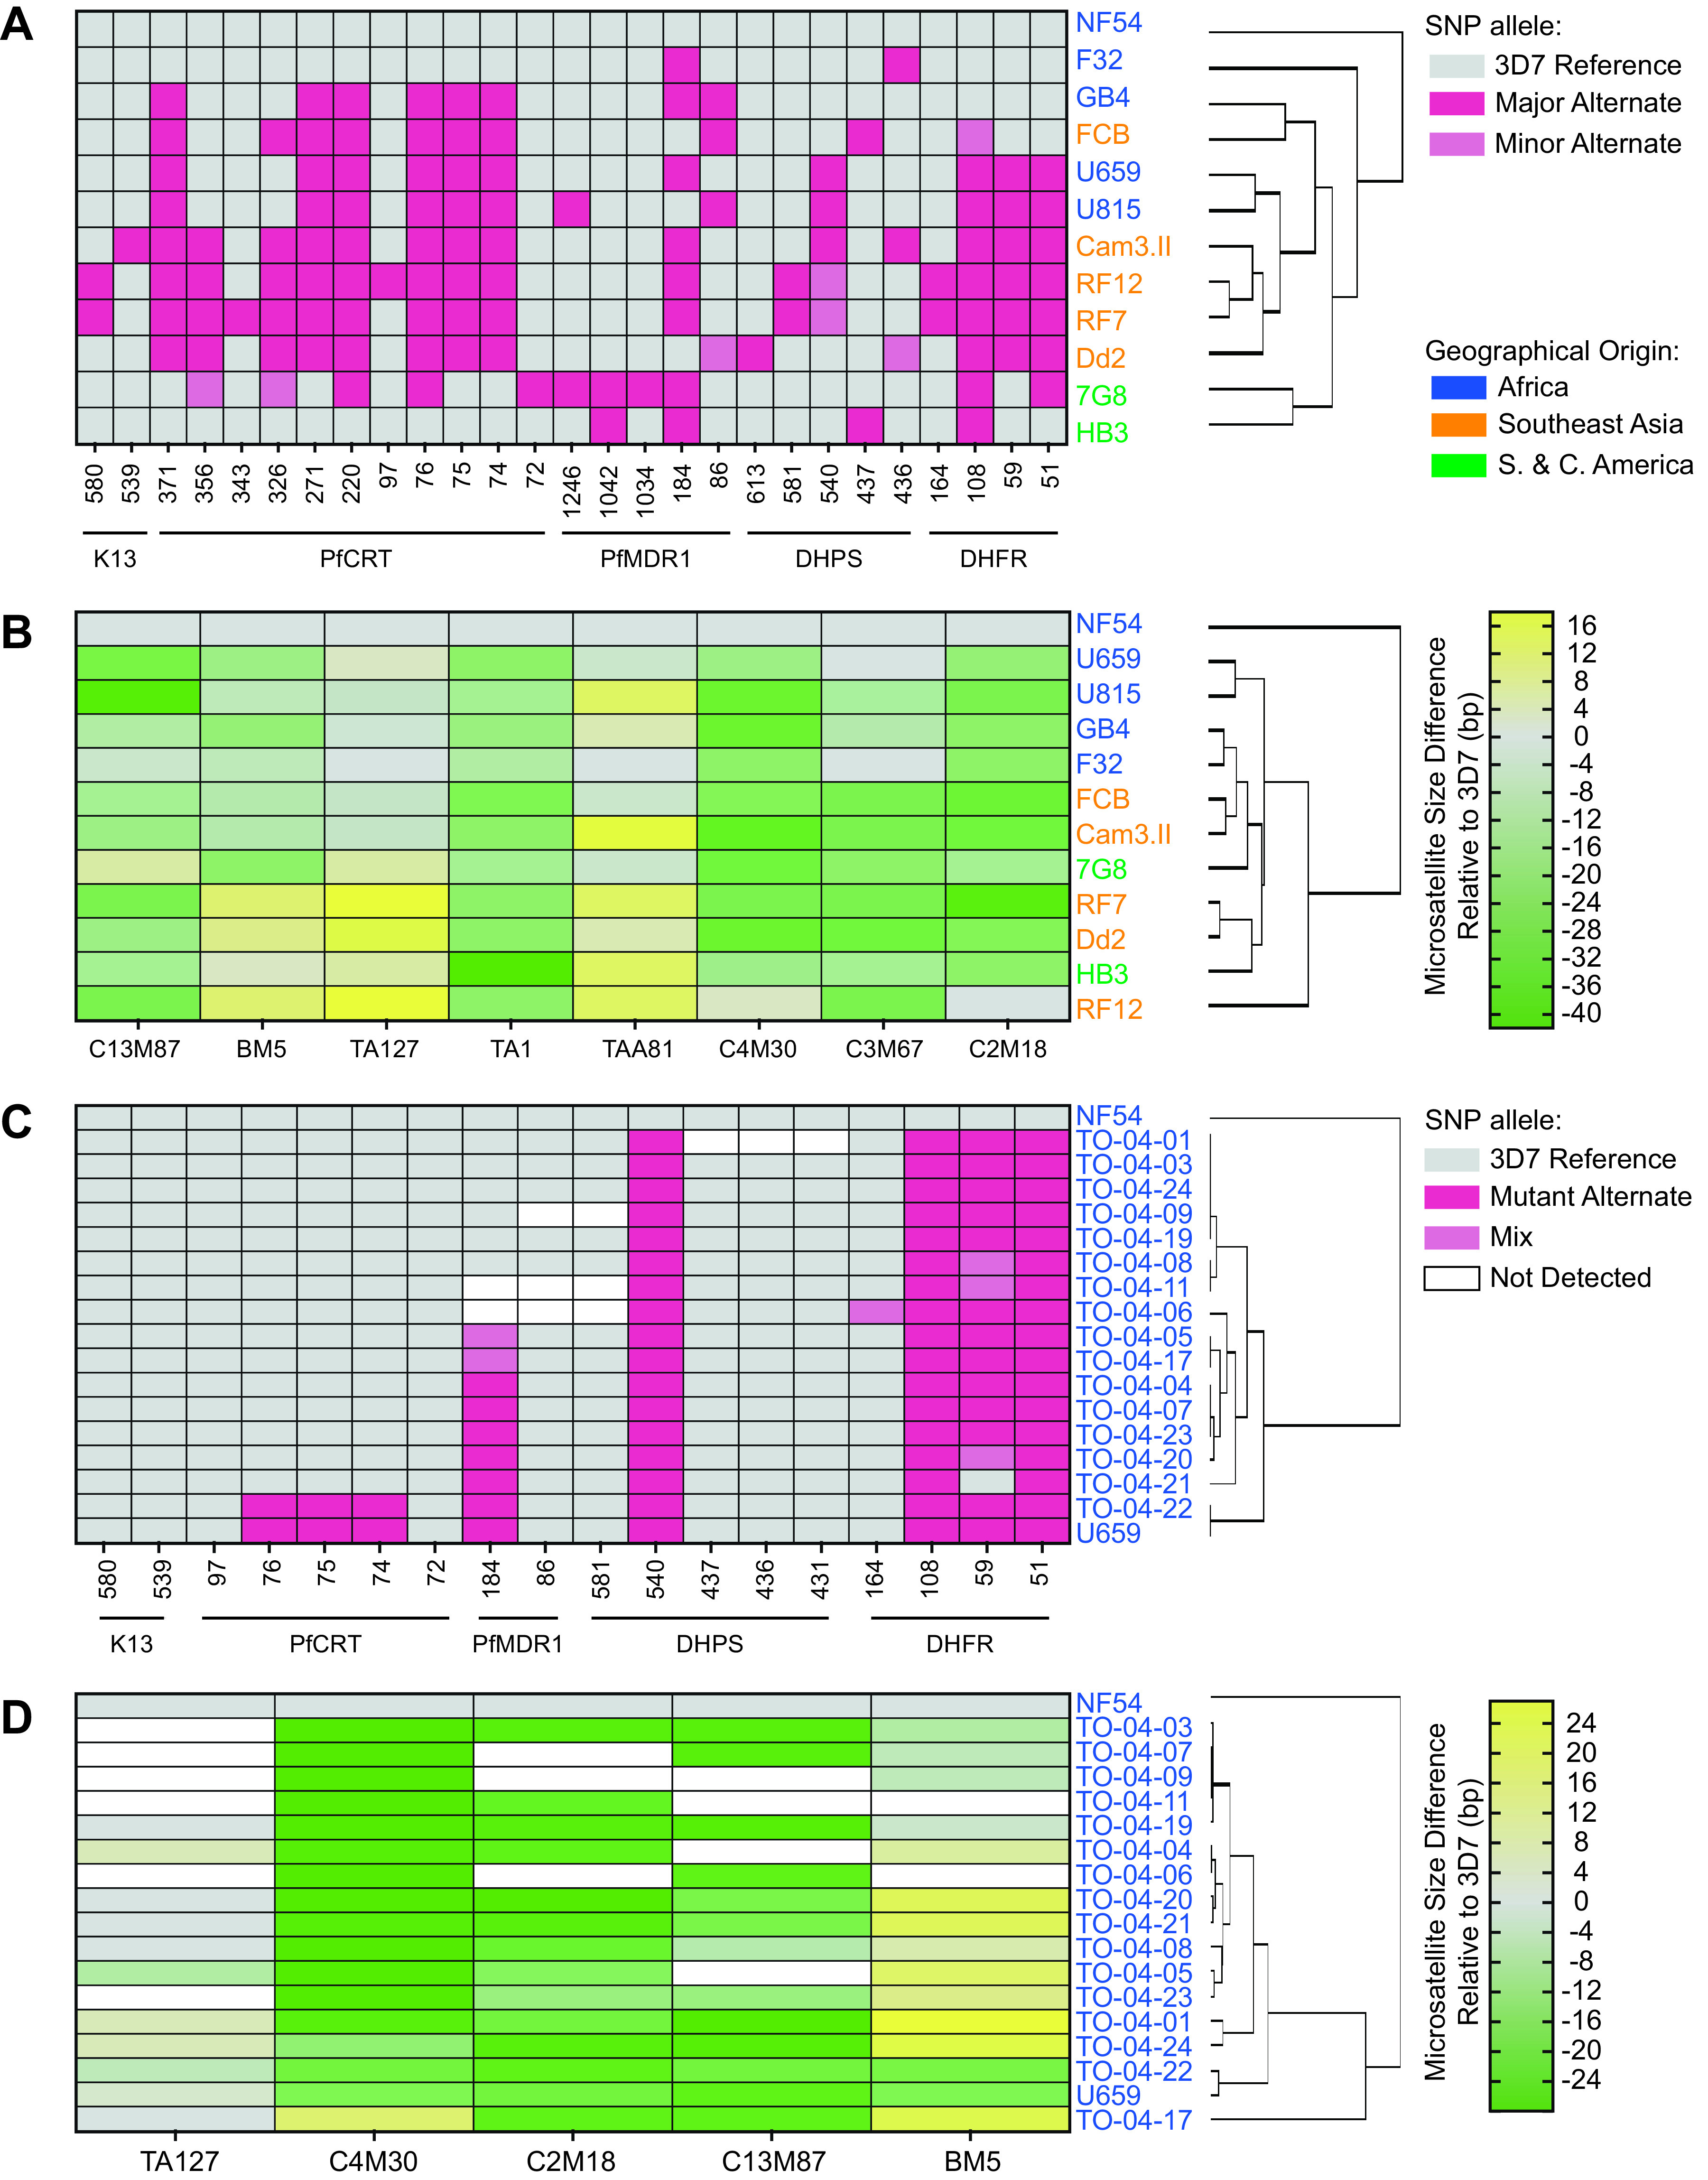
Hierarchical clustering of laboratory strains and Ugandan dried blood spot samples by their respective geographical origins using microsatellite (MS) or single-nucleotide polymorphism (SNP) markers. (A) Heatmap showing the clustering of 12 laboratory lines using 27 discriminatory SNPs in dhfr, dhps, pfmdr1, pfcrt, and k13. The other six SNPs were identical across all strains tested. (B) Heatmap depicting these laboratory strains clustered by eight MS markers. Parasite geographical origins are indicated by font color. Major versus minor alternate alleles, and the size of MS insertions or deletions, are indicated by the color scale. (C) Heatmap showing the clustering of 16 Ugandan samples alongside two control lines using 18 SNPs in dhfr, dhps, pfmdr1, pfcrt, and k13. (D) Heatmap of Ugandan samples and two control lines clustered by five MS markers (also see Table S4).