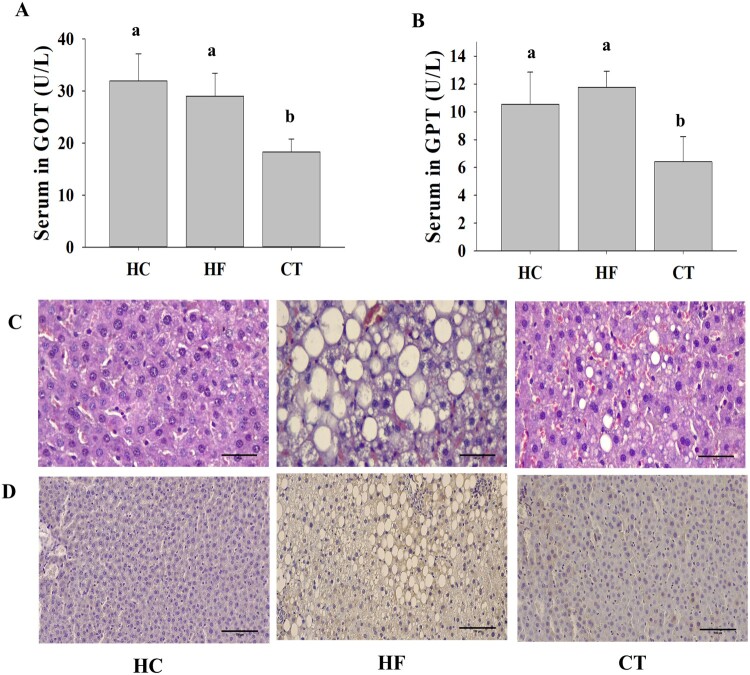
Figure 3.
Effects of CT on liver function in HF diet-fed rats. (A) GOT levels. (B) GPT levels. (C) Hematoxylin and eosin (H&E) staining at 400 × magnification. Scale bar: 50 μm. (D) Immunohistochemical staining against TNF-α in liver paraffin sections at 200 × magnification. Scale bar: 100 μm. Data are presented as means ± SDs. Different letters indicate significant difference (p <0.05). HC, 46% carbohydrate diet; HF, 60% fructose diet; CT, 60% fructose diet with C. trichotomum leaf extract (500 mg/kg of body weight).

