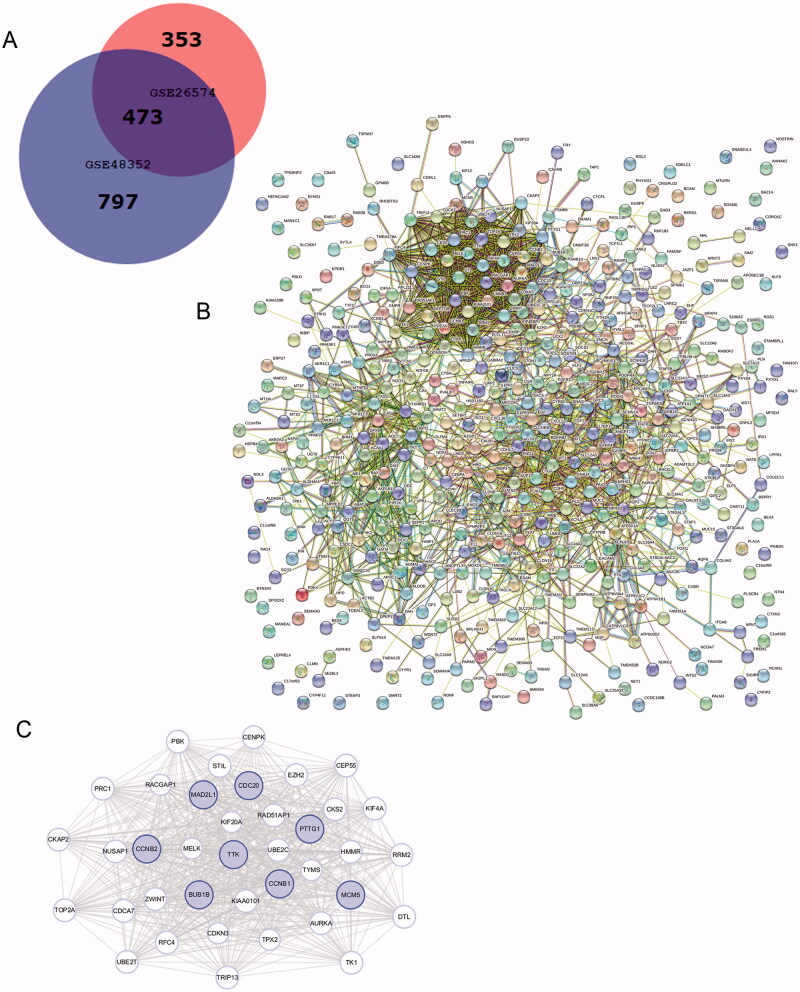
Figure 1.
Venn diagram, PPI network, and the most significant module of DEGs. (A) DEGs were selected with a fold change >2 and p-value <.01 among the mRNA expression profiling chip datasets GSE48352 and GSE26574. The 2 datasets show an overlap of 473 genes in the Venn diagram. (B) The PPI network of DEGs was constructed using STRING. (C) The most significant module was obtained from the PPI network with 38 nodes. Significant edges are related to the cell cycle and they are marked in light blue.

