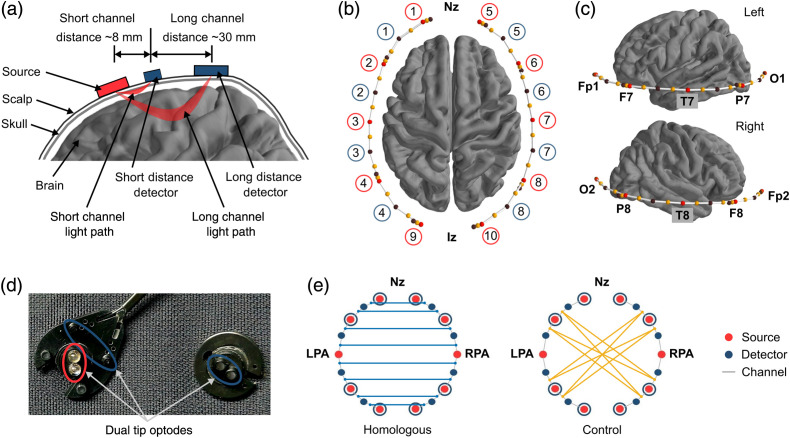
Fig. 1.
Illustration of the optode montage and the connectivity groups used in this study. (a) Schematic diagram showing the differences in light path and penetration depth of long channels and short channels. (b) Top-view of the optode montage. Sources and detectors are marked with red and brown dots and their numbers are displayed in red and blue circles, respectively. Channels are marked with solid white lines and the mid-point of each channel is marked with a yellow dot. (c) Side-view of the optode montage. Registered channel positions are shown on left and right hemispheres of the brain with respect to the landmarks of international 10–20 standard (i.e., Nz, Cz, Iz, LPA, and RPA). (d) Physical layout of dual-tip optodes. (e) Channel pair definition of the connectivity groups; homologous connectivity group linking channels in interhemispheric frontal, temporal, and occipital homologous regions and control connectivity group comprises long distance connections that have no known direct structural linkage to date.

