FIG 1.
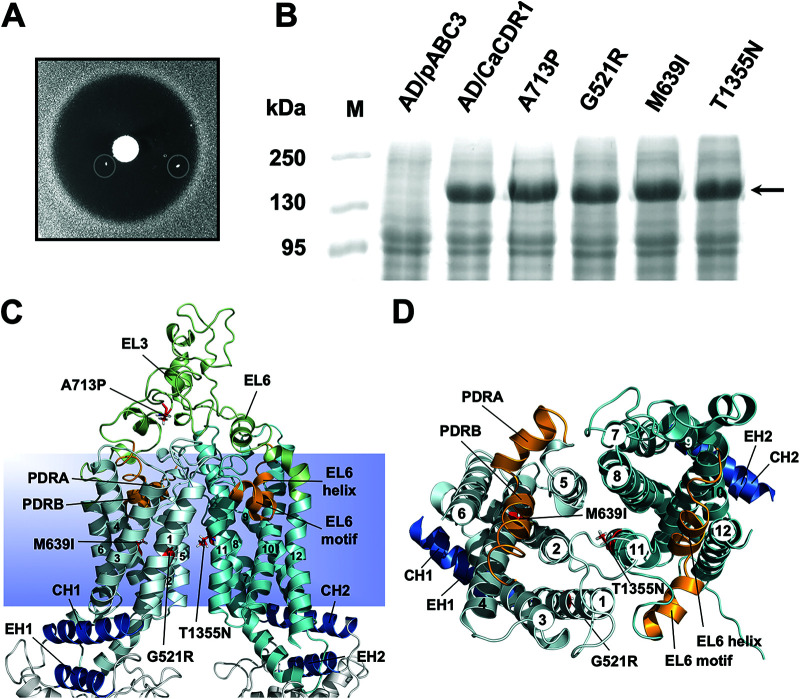
Isolation of milbemycin α25-resistant FLC efflux pump mutants of S. cerevisiae AD1-8u- cells overexpressing C. albicans CDR1. (A) Individual colonies (circled) resistant to milbemycin α25 appeared within the growth inhibitory zones surrounding a milbemycin α25 (5 μg) disc placed on YPD agar medium containing 0.25 MIC (128 μg/mL) of FLC after 7 days of incubation at 30°C. (B) Cdr1 expression in AD/CDR1, milbemycin α25-resistant mutants (G521R, A713P, M639I, and T1355N), and the negative-control strain AD/pABC3. Plasma membrane preparations (30 μg) isolated from logarithmic-phase cells were separated by 8% SDS-PAGE and visualized with Coomassie brilliant blue R-250 staining. The arrow indicates the ∼170-kDa Cdr1 protein band. (C and D) Cartoon models of the TMDs of the inward-open conformation of Cdr1 (17) with TMS1-12 numbered 1 to 12. TMD1 is light blue, TMD2 is cyan, and EL3 and EL6 are green. The coupling helices (CH1 and CH2) and the E-helices (EH1 and EH2) that connect the TMDs to the NBDs are blue, and the residues causing milbemycin α25 resistance, namely G521R (TMS1), M639I (TMS4), A713P (EL3) and T1355N (TMS11), are shown as red sticks. The images in C and D show the TMDs viewed from the side (C) or the top (D) with EL3 and EL6 and the NBDs removed in D for clarity. The PDR transporter-defining motifs (orange) that dip halfway down into the TMDs of the transporter fit tightly between TMS2, -4, -5, and -6 (i.e., PDRA-PDRB) and TMS8, -10, -11, and -12 (i.e., EL6 helix-EL6 motif), respectively.

