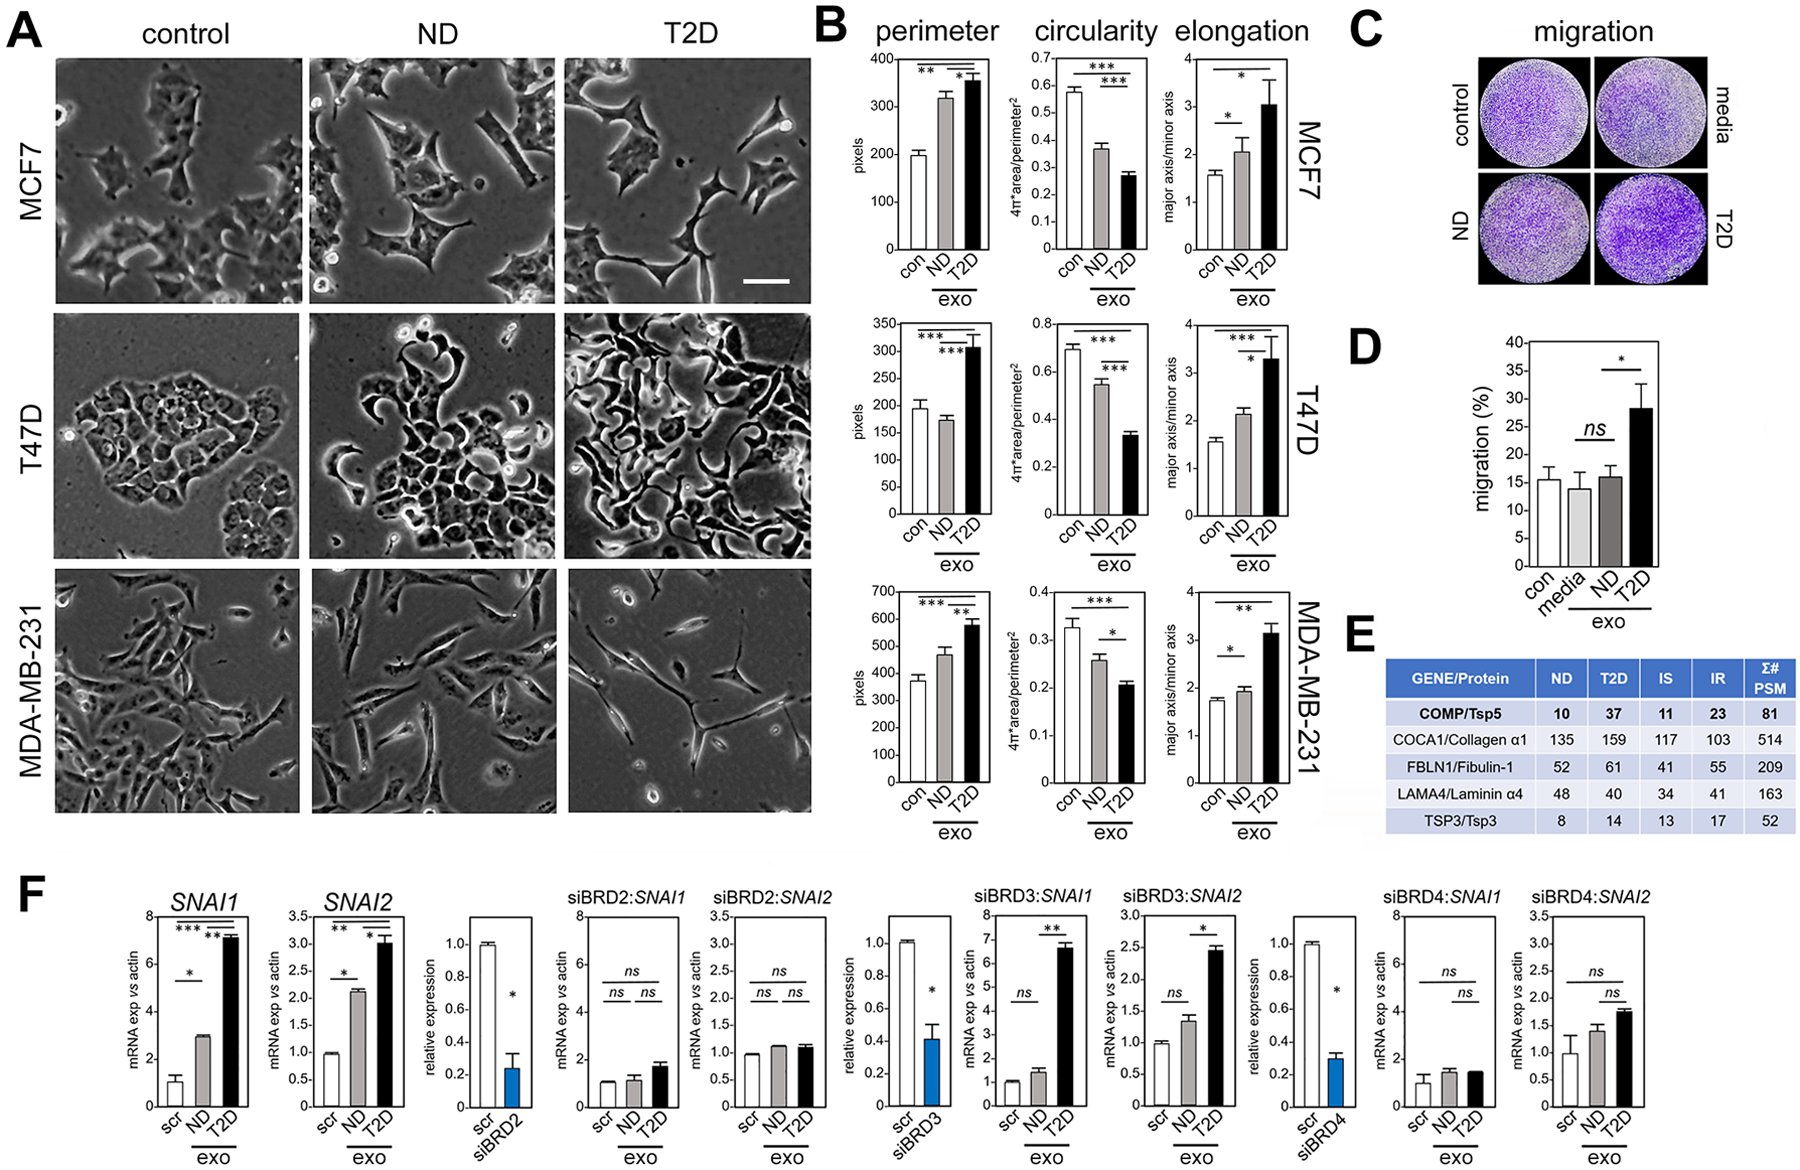
Fig. 3. Exosomes from adipocytes of T2D patients induce morphological, transcriptional and migration phenotypes characteristic of EMT in human breast cancer cells, compared to exosomes from adipocytes of ND patients.

(A) Treatment for 5 days of three human breast cancer cell lines (MCF7, T47D, MDA-MB-231) with exosomes from adipocytes of T2D patients compared to ND patients or to untreated control (con). Morphology by light microscopy. Scale bar, 30 μm. One representative image is shown, out of 25 images collected for each of the three experimental conditions with three replicates. (B) Cellular perimeter, circularity and elongation (a parameter that is converse to circularity) were measured in each model after exposure to exosomes (exo) from adipocytes of ND patients and T2D patients, and compared to vehicle control (con). Morphological analysis was conducted using ImageJ. N=3 independent experiments, n = 25 cells each. * P <0.05, ** P <0.01, *** P <0.001 by unpaired, two-tailed t-test. (C) Migration of MDA-MB-231 breast cancer cells was measured in a 6-hour transwell assay after exposure to exosomes from conditioned media of adipocytes of ND patients and T2D patients, compared to control exosomes isolated from media without adipocyte culture, and vehicle control.. Cells that reached the distal side of the 8-μm pore membrane were visualized by crystal violet stain and microscopy. (D) Quantitation of (C). Data are from N=3 independent experiments. * P <0.05 and ns not significant by unpaired, two-tailed t-test compared to vehicle control. (E) Unbiased proteomic analysis of human adipocyte exosomes by LC-MS/MS. Σ# PSM (number of Peptide-Spectrum Matches) reports the sum of occurrences of unique peptides for each protein. (F) Exosomes from either T2D or ND adipocytes (exo) were tested for ability to induce transcription of SNAI and SNAI2 in MCF7 cells, in the context of siRNA knockdown of BRD2, BRD3 or BRD4. Gene expression is relative to β-actin and compared to scrambled siRNA control (scr). Control experiments without knockdown constructs are shown at far left, followed in order by knockdown of each BET gene. Positive controls for knockdown efficiency (blue bar) are shown before each experiment, with relative expression compared to scrambled control (scr). Data are from N=3 independent experiments. * P <0.05, ** P <0.01, *** P <0.001, and ns not significant by unpaired, two-tailed t-test compared to scrambled control.
