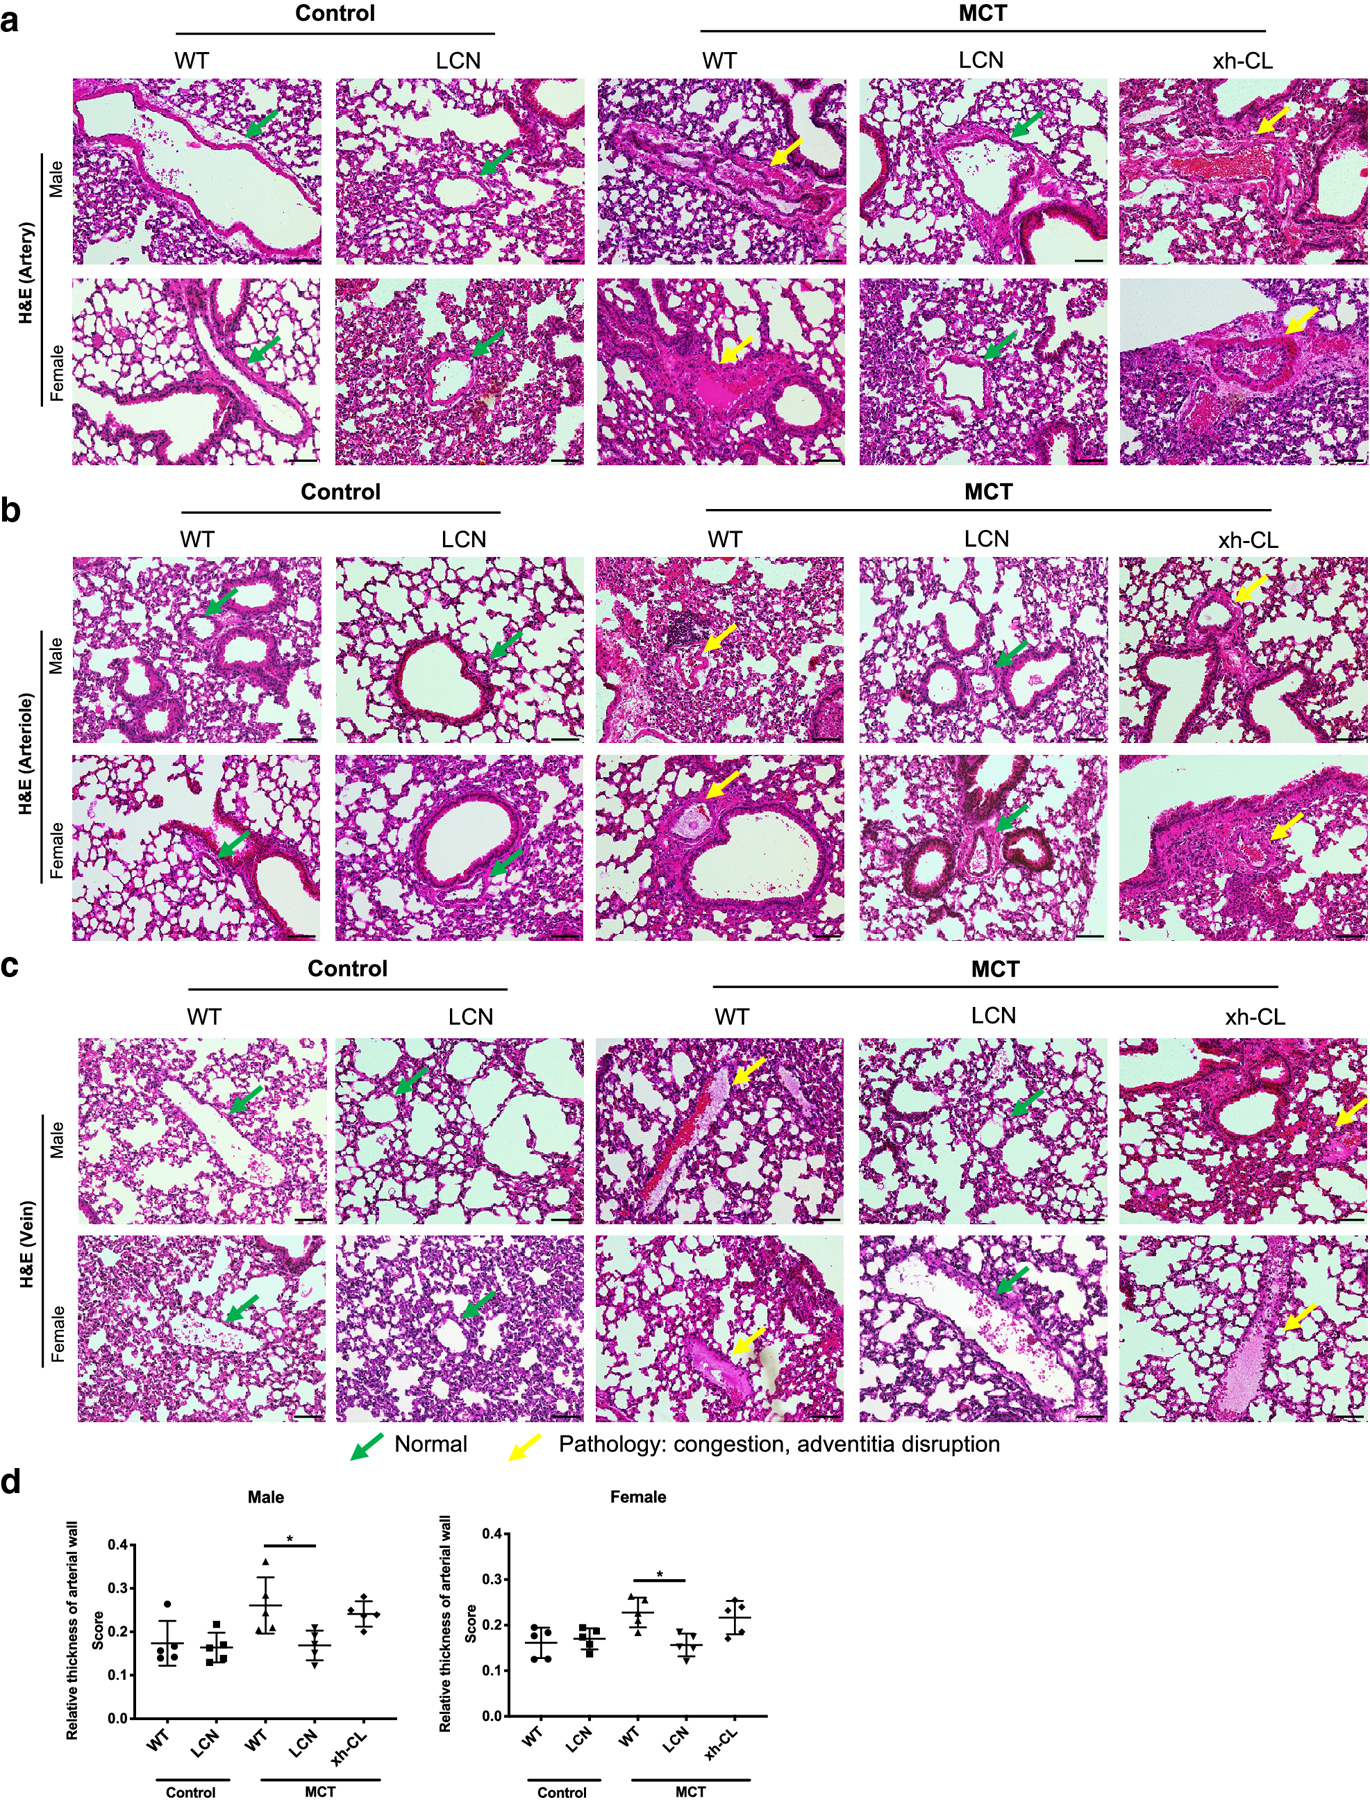
Fig. 4.

Histopathological analysis of MCT-induced changes in pulmonary vasculature. Lungs were collected from adult (2–3 months old) male and female mice at 48 h after a single oral administration of MCT (120 mg/kg) or saline (vehicle control). Representative data from H&E stained lung sections are shown for pulmonary arteries (a), arterioles (b) and veins (c). Normal pulmonary vasculature (green arrows) and characteristic MCT-induced pathologic changes (yellow arrows) are indicated. Scale bars=200 μm. (d) Scoring on the relative thickness of pulmonary arterial wall of control or MCT-exposed mice. Data are presented as means ± SD (n=5). Kruskal-Wallis test was used. *p<0.05.
