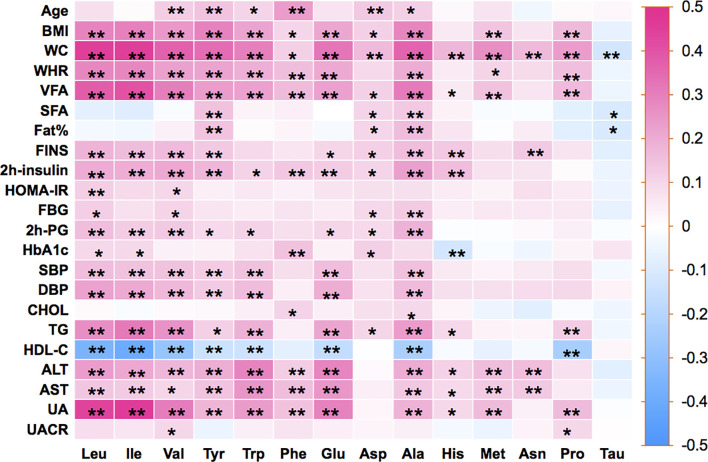
Figure 1.
Pearson’s correlation coefficients were calculated between 14 amino acids and metabolic-related variables. BMI, body mass index; WC, waist circumference; WHR, waist-to-hip ratio; Fat%, body fat percentage; VFA, visceral fat area; SFA, subcutaneous fat area; FINS, fasting serum insulin; HOMA-IR, homeostasis model assessment for insulin resistance; FPG, fasting blood glucose; 2h-PG, 2-h postprandial glucose; HbA1c, glycosylated hemoglobin A1c; SBP, systolic blood pressure; DBP, diastolic blood pressure; TC, total cholesterol; TG, triglyceride; HDL-c, high-density lipoprotein-cholesterol; ALT, alanine aminotransferase; AST, aspartate aminotransferase; UA, uric acid; UACR, urine albumin-to-creatinine ratio; Ile, isoleucine; Leu, leucine; Val, valine; Tyr, tyrosine; Trp, tryptophan; Phe, phenylalanine; Glu, glutamic; Asp, aspartic; Ala, alanine; His, histidine; Met, methionine; Asn, asparagine; Pro, proline; Tau, taurine. Statistical differences between 14 amino acids and metabolic-related variables are shown as *P < 0.05 and **P < 0.01.

