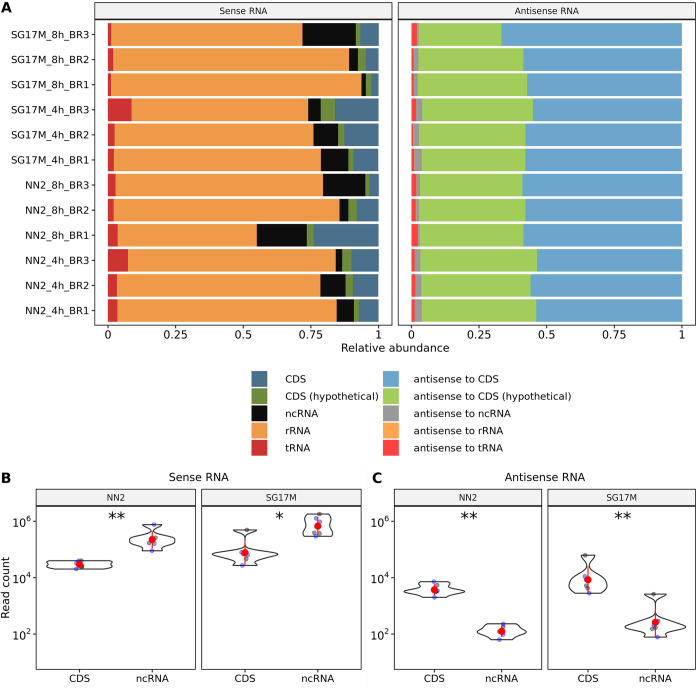
FIG 2.
Abundances of sense and antisense transcripts with regard to the genomic feature types. (A) Relative abundances of sense (left) and antisense (right) RNA transcripts obtained from nonnormalized read counts in the biological replicates (BR1 to BR3) of SG17M and NN2 at 4- and 8-h time points. The reads were classified according to their alignment toward a known coding sequence (CDS), a coding sequence with no functional annotation (hypothetical), a noncoding sequence (ncRNA), rRNA (rRNA), and tRNA (tRNA). The variance observed between replicates and strains can be obtained from Fig. S4. (B) Representation of the log10-scaled counts of sense transcripts mapping to CDS or ncRNA regions in NN2 and SG17M at the mid-exponential phase (blue dots) and the early stationary phase (black dots). The red dots and red lines reveal the means and standard deviations. Most of the sense transcripts aligned to ncRNA regions in NN2 (Wilcoxon P value = 0.002; effect size r = 0.8; confidence interval = 0.63 to 0.85) and SG17M (Wilcoxon P value = 0.02; effect size r = 0.69; confidence interval = 0.26 to 0.85). (C) The log10-scaled antisense transcript count was significantly higher in CDS than in ncRNA regions with known and undefined annotations in both NN2 (Wilcoxon P value = 0.002, effect size r = 0.83; confidence interval = 0.63 to 0.85) and SG17M (Wilcoxon P value = 0.002; effect size r = 0.83; confidence interval = 0.63 to 0.85). *, P < 0.05; **, P < 0.01.

