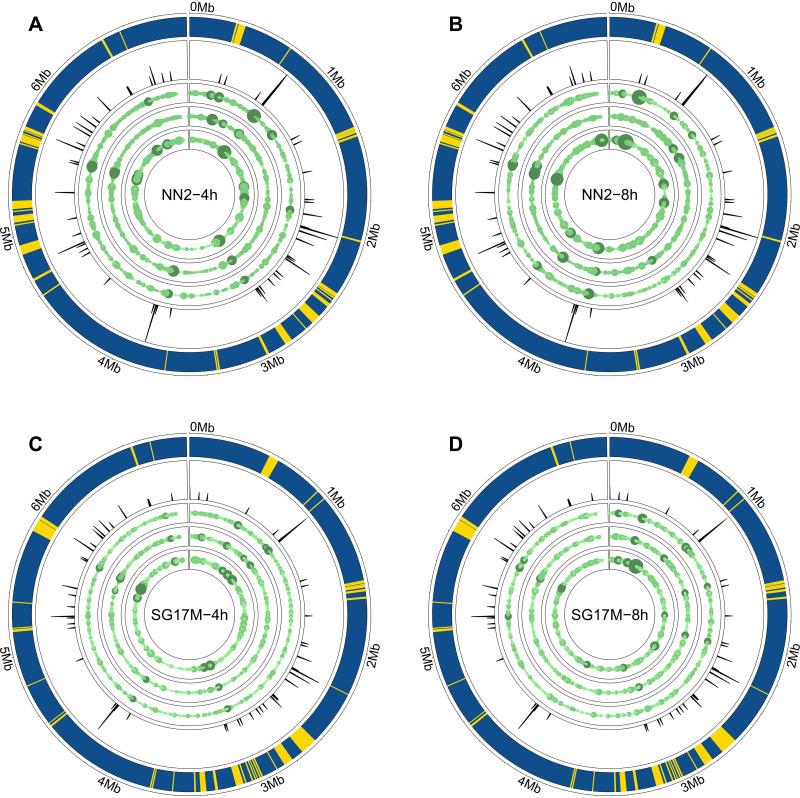
FIG 4.
Genome visualization of antisense transcript hot spots in P. aeruginosa clone C isolates with the R package circlize (67). The outermost circle represents the core (blue) and accessory (yellow) genome as predicted by IslandViewer4 (68). The second circle shows the frequency of tRNAs in the genome sequence. The third, fourth, and fifth lanes depict antisense coverage in the first, second, and third biological replicates of NN2 in mid-exponential phase (A), NN2 in early stationary phase (B), SG17M in mid-exponential phase (C), and SG17M in early stationary phase (D). The number of antisense transcripts was normalized beforehand (TMM-normalized log2-scaled CPM). The higher the antisense transcript coverage, the larger the circle and the darker the green color. The overall design of the figure was inspired by Fig. 6 in the publication of Wurtzel and colleagues (20) to allow direct comparison between their and our data.

