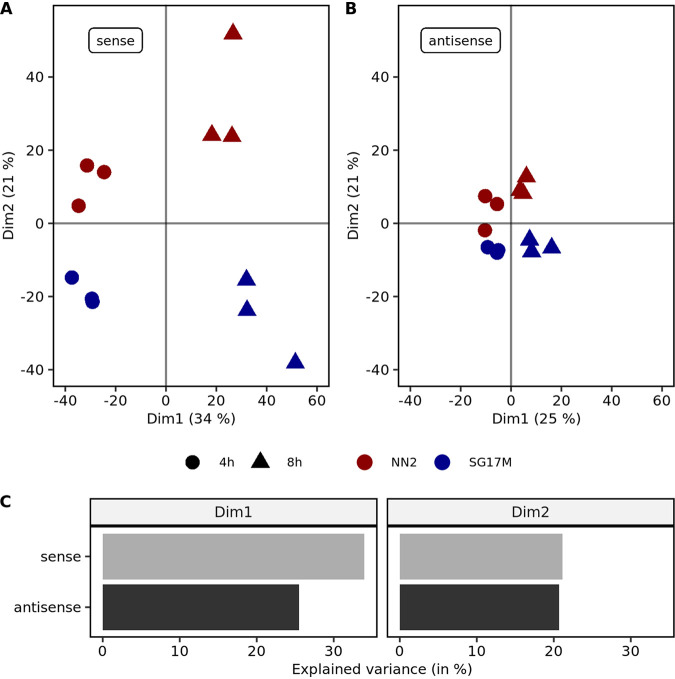
FIG 7.
Principal-component analysis (PCA) of sense and antisense mRNA expression. (A) The first principal component in sense mRNA expression PCA explains 34% of the observed variance mainly between the mid-exponential (circles) and early stationary (triangles) growth phases. The second principal component explains about 21% of the variance and predominantly separates NN2 (red) and SG17M (blue) biological replicates. (B) The first principal component in antisense mRNA expression PCA explains 25% of the observed variance mainly between the mid-exponential (circles) and early stationary (triangles) growth phases. The second principal component explains about 21% of the variance and predominantly separates NN2 (red) and SG17M (blue) biological replicates. (C) In the first dimension (Dim1), which was found to explain the variance between time points, sense mRNA expression is slightly more important. For the second dimension (Dim2), which separates the SG17M and NN2 isolates, antisense and sense mRNA expressions contribute equally to the variance.

