

ABSTRACT
The auxin indole-3-acetic acid (IAA) is a plant hormone that not only regulates plant growth and development but also plays important roles in plant-microbe interactions. We previously reported that IAA alters expression of several virulence-related genes in the plant pathogen Pseudomonas syringae pv. tomato strain DC3000 (PtoDC3000). To learn more about the impact of IAA on regulation of PtoDC3000 gene expression, we performed a global transcriptomic analysis of bacteria grown in culture, in the presence or absence of exogenous IAA. We observed that IAA repressed expression of genes involved in the type III secretion (T3S) system and motility and promoted expression of several known and putative transcriptional regulators. Several of these regulators are orthologs of factors known to regulate stress responses and accordingly expression of several stress response-related genes was also upregulated by IAA. Similar trends in expression for several genes were also observed by quantitative reverse transcription PCR. Using an Arabidopsis thaliana auxin receptor mutant that accumulates elevated auxin, we found that many of the P. syringae genes regulated by IAA in vitro were also regulated by auxin in planta. Collectively the data indicate that IAA modulates many aspects of PtoDC3000 biology, presumably to promote both virulence and survival under stressful conditions, including those encountered in or on plant leaves.
IMPORTANCE Indole-3-acetic acid (IAA), a form of the plant hormone auxin, is used by many plant-associated bacteria as a cue to sense the plant environment. Previously, we showed that IAA can promote disease in interactions between the plant pathogen Pseudomonas syringae strain PtoDC000 and one of its hosts, Arabidopsis thaliana. However, the mechanisms by which IAA impacts the biology of PtoDC3000 and promotes disease are not well understood. Here, we demonstrate that IAA is a signal molecule that regulates gene expression in PtoDC3000. The presence of exogenous IAA affects expression of over 700 genes in the bacteria, including genes involved in type III secretion and genes involved in stress response. This work offers insight into the roles of auxin-promoting pathogenesis.
KEYWORDS: Arabidopsis, type III secretion, auxin, gene expression, indole-3-acetic acid, pathogenesis, plant pathogen, virulence
INTRODUCTION
Pseudomonas syringae pv. tomato strain DC3000 (PtoDC3000) is a pathogen of tomato and crucifers that also causes disease on Arabidopsis thaliana (1). The PtoDC3000-A. thaliana interaction serves as a model system for studying plant-pathogen interactions and for understanding molecular mechanisms involved in pathogenesis. During its life cycle, PtoDC3000 initially grows epiphytically, colonizing the surface of healthy plants before entering into leaf tissue through stomata or wounds. Once in the apoplast, it suppresses basal defense responses utilizing a variety of strategies, including type III secretion (T3S), to deliver virulence proteins (also called effector proteins) directly into host cells. Many T3S effector proteins suppress host immune pathways, while others alter host cell signaling and physiology in other ways to render plant tissue more amenable for pathogen growth (2–4). PtoDC3000 can then obtain water and nutrients, grown to high levels in the apoplast, and ultimately cause visible disease symptoms that include chlorosis and water-soaked or necrotic lesions (1, 5).
Transcription of genes encoding the T3S system in PtoDC3000 is induced early during the infection process (6) and is dependent on HrpL, an extracytoplasmic function (ECF) family alternative sigma factor (7). Studies aimed at elucidating the mechanisms governing expression of the T3S system and other virulence factors of PtoDC3000 have revealed that regulation of pathogenicity is complex (8–13). For example, several different plant-derived compounds, including sugars, organic acids, amino acids, and the plant hormone auxin, have been shown to modulate expression of T3S genes, and it has been proposed that one or more of these molecules may serve as signals to coordinate virulence gene expression during infection (11, 12, 14).
Auxins represent a major class of phytohormones that is involved in the coordination of plant growth and development (15, 16). There is growing evidence that auxin can also play a role in plant–pathogen interactions, often acting to promote host susceptibility and disease symptom development (17–19). Several plant pathogens, including PtoDC3000, manipulate the auxin physiology of their hosts using a variety of strategies, including synthesis of the auxin indole-3-acetic acid (IAA) and production of virulence factors that alter auxin signaling in the host (20). We recently demonstrated that in interactions between PtoDC3000 and A. thaliana, IAA plays two different roles in promoting pathogen growth and disease development: as a plant hormone to suppress salicylic acid (SA)-mediated basal host defenses (21) and as a microbial signal that regulates virulence gene expression (14). The latter finding is consistent with previous studies showing that IAA serves as a signaling molecule that regulates gene expression in several plant-associated microbes. For example, application of IAA stimulates changes in gene expression in the plant pathogens Agrobacterium tumefaciens (22) and Dickeya dadantii (23) as well as in the beneficial rhizobacteria Rhizobium etli (24) and Azospirillum brasilense (25). These studies revealed that IAA regulates genes involved in a variety of biological processes, including stress tolerance, antibiotic production, adaptation to growth in new environments, and pathogenesis (20). However, as these previous studies were carried out in culture, auxin-regulated gene expression in the context of plant hosts has not been explored.
Given our recent discovery that IAA acts as a signaling molecule to modulate PtoDC3000 virulence-related genes (14), we were interested in determining if IAA has broader impacts on PtoDC3000 gene expression. Thus, we initiated a global transcriptomic study using RNA sequencing (RNA-seq) and quantitative reverse transcription PCR (RT-qPCR) to monitor bacterial gene expression in culture in the presence and absence of exogenously administered IAA. We also tested the expression of several IAA-responsive genes in planta, taking advantage of an A. thaliana auxin receptor mutant that accumulates elevated IAA levels. Our results provide important insights into the impact of IAA on PtoDC3000 gene expression and suggest that IAA modulates many aspects of PtoDC3000 biology, including downregulation of T3S, and induction of genes implicated in stress tolerance.
RESULTS AND DISCUSSION
We recently discovered that IAA can act as a signaling molecule to regulate virulence gene expression in PtoDC3000 (14). However, this was deduced based on the analysis of a few known virulence-related genes (avrPto, hrpL, and tvrR). To investigate the broader impacts of IAA on gene expression of PtoDC3000, we used transcriptome sequencing (RNA-seq) to explore the global changes in transcription in bacteria grown in culture in response to IAA treatment.
Analysis of RNA-seq data sets of PtoDC3000 following IAA treatment.
To investigate the contribution of IAA in the regulation of PtoDC3000 gene expression, we cultured PtoDC3000 in rich medium (NYG) for several hours and then transferred cells to Hrp-derepressing medium (HDM), a minimal medium that mimics some conditions in the apoplastic space of the leaf. Important virulence genes, such as those encoding components of the T3S apparatus, are expressed in HDM (6, 12, 26). Duplicate mid-log-phase PtoDC3000 cultures growing in HDM or HDM supplemented with IAA (HDM + IAA) were collected for RNA extraction at 30, 60, and 90 min after addition of IAA. cDNA libraries for two biological replicates were constructed for each time point and sequenced. The RNA-seq produced high genome coverage and revealed that IAA treatment resulted in many transcriptional changes in PtoDC3000, and that the biological replicates showed a very high level of correlation (r ≥ 0.95) within each time point (data not shown). DeSeq2 was then used as previously described to identify statistically significant differences in gene expression between bacteria grown in HDM and HDM + IAA (9, 27). At 30 min after IAA addition, we observed a total of 740 differentially expressed genes (DEGs; 376 upregulated and 364 downregulated by IAA); at 60 min, we observed a total of 447 DEGs (284 upregulated and 163 downregulated by IAA); and at 90 min, we observed a total of 360 DEGs (219 upregulated and 141 downregulated by IAA) (Fig. 1A and B; see also Table S1 in the supplemental material). The large number of genes differentially expressed between PtoDC3000 grown in HDM and HDM + IAA confirms our earlier finding that PtoDC3000 responds to IAA (14).
FIG 1.

Summary of transcriptional profiling of PtoDC3000 genes regulated by IAA in culture. (A) Venn diagram showing overlapping differentially expressed genes downregulated in response to auxin treatment compared to the control (DMSO) at 30, 60, and 90 min after transfer to HDM. (B) Venn diagram showing overlapping differentially expressed genes upregulated in response to auxin compared to DMSO at 30, 60, and 90 min after transfer to HDM. (C) Heat map of a subset of differentially expressed genes that were downregulated following treatment with auxin. (D) Heat map of a subset of differentially expressed genes that were upregulated following treatment with auxin. The heat maps show the normalized log2 fold change of the genes across all three time points. Genes of interest referred to in the text are indicated to the right of each heat map. chp, small conserved hypothetical protein.
To better visualize the changes across the three time points, we generated a heat map, portions of which are shown in Fig. 1C and D. The heat map shows that transcript levels of many genes were reduced in the presence of IAA at two or more time points, including several genes encoding proteins involved in T3S (e.g., hrp, hrc, and hop genes). The heat map also reveals several genes whose transcript levels were increased in the presence of IAA at all three time points (Fig. 1D). Although some genes show more complex patterns of expression (e.g., up- or downregulated at only two of three time points), we do not know if this is biologically relevant, as transcript levels can be influenced by many factors, such as transcript stability. Given the dramatic changes observed by 30 min posttransfer to HDM + IAA, we focused our analysis on the 30 min data set.
To gain insight into the function of PtoDC3000 IAA-responsive genes, the DEGs were annotated using the Pseudomonas genome database (https://www.pseudomonas.com) (Table S1) and grouped accordingly into various functional categories using Clusters of Orthologous Groups (COG) analysis (28) (Fig. 2). The functional categories with the largest number of genes whose expression was influenced by IAA included energy production and conversion, metabolism, secretion, transcription, translation, defense mechanisms, cell wall structure and cell wall, biogenesis, and outer membrane. Genes encoding virulence factors such as T3S components and effectors were placed in COG V. Approximately 200 DEGs predicted to encode hypothetical proteins, proteins of unknown function, or proteins that do not fit a defined category were not included in the summary diagram. The data show that most of the functional categories of PtoDC3000 contain genes both induced and repressed by IAA and indicate that IAA modulates many aspects of PtoDC3000 biology. Below we discuss the expression patterns of specific categories of genes, especially those known or predicted to be involved in pathogenesis.
FIG 2.

Functional categories of PtoDC3000 genes regulated by IAA in culture 30 min after addition of IAA. (A) Functional categories (COG) of PtoDC3000 genes upregulated by IAA. (B) COG categories of PtoDC3000 genes downregulated by IAA. COGs were assigned manually by following functional categories established by Tatusov et al. (28). COG categories S (no functional prediction, 71 up, 41 down) and “unknown” (no COG listed for this gene, 64 up and 28 down) are not included in the pie charts. Full COG category descriptions are the following: A, RNA processing and modification; C, energy production and conversion; D, cell division and chromosome partitioning; E, amino acid metabolism and transport; F, nucleotide metabolism and transport; G, carbohydrate metabolism and transport; H, coenzyme metabolism; I, lipid metabolism; J, translation, including ribosome structure and biogenesis; K, transcription; L, replication, recombination and repair; M, cell wall structure and biogenesis and outer membrane; N, secretion, motility, and chemotaxis; O, molecular chaperones and related functions; P, inorganic ion transport and metabolism; Q, secondary metabolite biosynthesis, transport, and catabolism; T, signal transduction; U, intracellular trafficking and secretion; and V, defense mechanisms (includes genes involved in virulence, such as T3S genes).
Genes regulated by IAA. (i) T3S system and T3E genes.
PtoDC3000 uses the Hrp/Hrc T3S system to deliver virulence (also called effector) proteins into the cytoplasm of host cells to promote disease (3, 5). As expected, we found that genes encoding both components of the T3S system and T3S effectors (T3Es), together with hrpL, which encodes the RNA polymerase sigma factor HrpL, responsible for initiating transcription of T3S-related genes, were expressed in HDM. We observed a significant reduction in transcript levels for almost all T3S-related genes in cultures treated with IAA (Table 1, Table S1). These findings are consistent with our previous observations for expression of avrPto and hrpL in PtoDC3000 growing in the presence of IAA (14). We also observed the downregulation of several genes encoding T3E chaperones (Table 1). Interestingly, a single effector gene, hopAH1, was induced following IAA treatment. The observation that hopAH1 does not appear to be regulated by HrpL (29) may explain, in part, why the expression of this gene in response to IAA is different than that of other T3S system-related genes.
TABLE 1.
Selected T3S genes and T3E genes (COG V) regulated by IAA
| Locus no. | Known or predicted function | Gene name | Fold changea |
|---|---|---|---|
| T3S system regulator: PSPTO_1404e | RNA polymerase sigma factor HrpL | hrpL | −3.09b |
| T3S system machinery | |||
| PSPTO_1373 | Type III helper protein HrpW1 | hrpW1 | −2.01 |
| PSPTO_1378 | Membrane-bound lytic murein transglycosylase D | hrpH | −2.87 |
| PSPTO_1381 | Hrp pilus protein HrpA1 (TTSS pilin HrpA) | hrpA1 | −2.49 |
| PSPTO_1389 e | Type III secretion protein HrcC | hrcC | −2.82 |
| PSPTO_1403 c | Type III secretion protein HrpJ | hrpJ | −2.68 |
| PSPTO_1405 | Type III helper protein HrpK1 | hrpK1 | −3.59 |
| PSPTO_4101 | Type III helper protein HopAK1 | hopAK1 | −2.42 |
| T3S system effectors | |||
| PSPTO_1370 | Type III effector HopN1 | hopN1 | −2.75 |
| PSPTO_1406 | Effector protein HopB1 | hopB1 | −2.54 |
| PSPTO_1568 | Type III effector HopAF1 | hopAF1 | −2.21 |
| PSPTO_4001 e | Type III effector AvrPto1 | avrPto1 | −2.51 |
| PSPTO_4331 | Type III effector HopE1 | hopE1 | −5.91 |
| PSPTO_4727 | Type III effector HopG1 | hopG1 | −3.94 |
| PSPTO_4776 | type III effector HopI1 | hopI1 | −2.40 |
| PSPTO_5354 | Type III effector HopA1 | hopA1 | −2.20 |
| PSPTO_0905 e | Type III effector HopAH1 | hopAH1 | 3.09 d |
| T3S system chaperones | |||
| PSPTO_0503 | Type III chaperone ShcF | shcF | −3.43 |
| PSPTO_1369 | Type III chaperone ShcN | shcN | −3.58 |
| PSPTO_4721 | Type III chaperone ShcV | shcV | −2.27 |
| PSPTO_5353 | Type III chaperone ShcA | shcA | −2.10 |
Fold change at 30 min posttransfer to HDM, unless otherwise noted.
Fold change at 60 min posttransfer to HDM. Differential gene expression was not observed at 30 min for this gene.
PSPTO_1403 is the first gene in the 12-gene hrpJ-hrcV-hrpQ-hrcN-hrpO-hrpP-hrcQaQbRSTU operon. Other genes in this operon show the same pattern of differential expression.
PSPTO_0905 (hopAH1) is the only known type III effector gene up regulated by IAA.
Analyzed by RT-qPCR in culture. Genes in boldface were also analyzed in planta.
Flagellum-, motility-, and chemotaxis-related genes.
We observed that several genes encoding components of the flagellum or that are involved in motility and chemotaxis, such as the flgBCDE operon, flgF, motA-1, and fleQ, were downregulated by IAA (Tables 2 and 3). The downregulation of flagellar genes is hypothesized to be a strategy to evade pattern-triggered immunity (PTI) (30), as it is well-documented that flagellin acts as microbial associated molecular pattern (MAMP) to trigger basal defenses in plants (31). Thus, the observation that IAA inhibits expression of flagellar genes is consistent with previous observations that IAA promotes virulence in P. syringae. Our findings are also consistent with reports that IAA appears to inhibit motility in other P. syringae strains (32). A possible mechanism for this downregulation is via downregulation of FleQ, a master regulator of flagellar genes (33), in response to IAA (Table 3).
TABLE 2.
Selected motility genes (COG N) regulated by IAA
| Locus no. | Known or predicted function | Gene name | Fold changea |
|---|---|---|---|
| Flagellar motility | |||
| PSPTO_1933 b | Flagellar hook-basal body complex protein FlgB | flgB | −2.61 |
| PSPTO_1939 | Flagellar basal body rod protein FlgF | flgF | −2.17c |
| PSPTO_1949 | Flagellin | fliC | −1.95c |
| PSPTO_1957 | Basal-body rod modification protein FliE | fliE | −2.02 |
| PSPTO_1984 | Flagellar motor protein MotA-1 | motA-1 | −2.17c |
| PSPTO_4953 | Flagellar motor protein MotA-2 | motA-2 | −2.02 |
| Chemotaxis | |||
| PSPTO_0117 | Methyl-accepting chemotaxis protein | −2.25 | |
| PSPTO_0911 d | Chemotaxis protein CheW | cheW-1 | 3.39 |
Fold change at 30 min posttransfer to HDM, unless otherwise noted.
PSPTO_1933 is the first gene in the 4 gene flgBCDE operon. The other genes in this operon show a similar pattern of differential expression (see Table S3 in the supplemental material).
Fold change at 90 min posttransfer to HDM. Differential gene expression was not observed at 30 min for these genes.
PSPTO_0911 is the only known motility and chemotaxis gene upregulated by IAA.
TABLE 3.
Selected transcription factor/regulator genes (COG K) regulated by IAA
| Locus no. | Known or predicted function | Gene name | Fold changea |
|---|---|---|---|
| Downregulated | |||
| PSPTO_1299 | Hex regulon repressor | hexR | −3.08 |
| PSPTO_1954 | Transcriptional regulator FleQ | fleQ | −1.99 |
| PSPTO_2128 | Response regulator | −3.33 | |
| PSPTO_2130 | LuxR family DNA-binding response regulator | −3.03 | |
| PSPTO_5669 | Noncoding small RNA psr2-crcX | psr2 | −2.97 |
| Upregulated | |||
| PSPTO_0157 | Transcriptional activator TrpI (regulates trpBA) | trpI | 2.08 |
| PSPTO_0365 | AraC family transcriptional regulator | 2.21 | |
| PSPTO_0570 | Transcriptional regulator PrtN | 2.17 | |
| PSPTO_0749 | Heavy metal-dependent transcriptional regulator | 2.46 | |
| PSPTO_1336 b | ArsR family transcriptional regulator | 2.05 | |
| PSPTO_1483 b | Response regulator/EAL domain protein | 2.94 | |
| PSPTO_1565 | RNA polymerase sigma factor RpoS | rpoS | 2.56 |
| PSPTO_1873 b | GntR family transcriptional regulator | 4.42 | |
| PSPTO_2395 | Transcriptional regulator | 2.22 | |
| PSPTO_2743 | MerR family transcriptional | 3.36 | |
| PSPTO_3076 | TetR family transcriptional regulator | 3.34 | |
| PSPTO_3547 | LysR family transcriptional regulator | 2.01 | |
| PSPTO_3549 b | TetR family transcriptional regulator AefR | aefR | 4.67 |
| PSPTO_3617 b | MarR family transcriptional regulator | 7.75 | |
| PSPTO_3749 b | MarR family transcriptional regulator | 24.4 | |
| PSPTO_4302 | TetR family transcriptional regulator PmeR | pmeR | 3.46 |
| PSPTO_4539 | LuxR family transcriptional regulator | 2.21 | |
| PSPTO_5116 | RpiR family transcriptional regulator | 2.60 | |
| PSPTO_5660 | Noncoding small RNA P16/rgsA | rgsA | 9.13 |
| PSPTO_5671 | Noncoding small RNA rsmX | rsmX | 6.59 |
| PSPTO_5674 | Noncoding small RNA rsmY | rsmY | 17.9 |
Fold change at 30 min posttransfer to HDM.
Analyzed by RT-qPCR in culture. Genes in boldface were also analyzed in planta.
Genes encoding TFs and transcriptional regulators.
Transcription factors (TFs) play key roles in bacteria by activating or repressing transcription, typically in response to environmental or cellular signals. We found that approximately 30 known and putative TFs and transcriptional regulators were induced in PtoDC3000 following IAA treatment (Fig. 2; Table 3). Some families of TFs we observed to be regulated by IAA are known to be involved in a variety of biological functions. For example, MarR-type transcriptional regulators constitute a prominent family of TFs critical for bacterial cells to respond to chemical signals and are involved in the reprogramming of gene expression in response to stress (34). Notably, the transcript level of PSPTO_3749, encoding a MarR family member, was the most highly induced TF regulated by IAA in our study (Table 3).
TetR-family transcriptional regulators are implicated in the regulation of many processes involved in virulence and stress tolerance (e.g., biofilm formation and efflux gene expression), metabolism, and cell division (35). Of particular interest here are two TetR family regulators, AefR (acyl homoserine lactone [AHL] and epiphytic fitness regulator) (36) and PmeR (Pseudomonas multidrug efflux regulator) (37), whose expression was enhanced by IAA (Table 3). AefR regulates many virulence-associated traits, including epiphytic fitness, production of AHL quorum-sensing molecules in P. syringae (36, 38–41), and transcription of the mexEF-oprN operon encoding a resistance-nodulation-division (RND) efflux system (13, 40, 41). Similarly, PmeR regulates expression of an RND efflux pump encoded by the mexAB-oprM operon (42, 43). As is discussed below, expression of these RND efflux systems is also affected by IAA. Additionally, the PmeR ortholog in P. fluorescens, EmhR, has been described as an indole-sensing transcription factor, and Han et al. (43) showed that, similar to EmhR, PmeR can also respond to indole. This finding raises the possibility that PmeR responds to other indole derivatives, such as IAA.
The rpoS gene was also induced by IAA (Table 3). This gene encodes an alternative RNA polymerase sigma factor that plays a central role in adaptation to suboptimal growth conditions by regulating expression of many genes that protect the cell from stress (44). Consistent with the increased expression of rpoS, we also observed an increase in the expression of the small RNA rgsA-P16 (PSPTO_5660), which has been shown to be regulated by RpoS (45). This suggests that IAA stimulates global changes in gene expression to facilitate PtoDC3000’s ability to adjust to growth under a variety of potentially stressful environmental conditions.
Small ncRNAs may provide an additional layer of regulation in response to IAA.
Small noncoding RNAs (ncRNAs) are important regulators of bacterial gene expression. We observed a decrease in expression of the ncRNA psr2-crcX (PSPTO_5669) when PtoDC3000 was exposed to IAA. crcX acts by sequestrating the carbon catabolite repression protein Crc (46). A decrease in expression of this ncRNA would thus impact the function of Crc, which has been shown to promote survival of PtoDC3000 in plant tissue (47). Our data suggest that the presence of auxin reduces expression of crcX, allowing Crc to act to help protect cells from stressful conditions in the plant environment. We also observed an increase in the expression of two additional ncRNAs, rsmX (PSPTO_5671) and rsmY (PSTO_5674), in the presence of IAA (Table 3). These and several other ncRNAs are regulated by the master regulator GacA and act by sequestering the Rsm RNA binding proteins, which have been shown to play different roles in modulating virulence in PtoDC3000 (48). Thus, our data suggest that IAA impacts this regulatory cascade (49, 50).
Stress response-related genes regulated by IAA.
Several additional PtoDC3000 stress response-related genes were induced following IAA treatment (Table 4). Two of these genes, PSPTO_1767 (ohr) and PSPTO_4530 (katG), are likely involved in protection against oxidative stress. For example, ohr1, which is predicted to encode a thiol-dependent peroxidase, plays a central role in bacterial response to stress induced by organic peroxides (51). Likewise, katG encodes a catalase that detoxifies hydrogen peroxide (52, 53). Two genes, PSPTO_0443 (betA) and PSPTO_1243 (algD), that encode enzymes involved in the synthesis of the osmoprotectants glycine betaine and alginate, respectively, are also upregulated by IAA; these genes might help protect the bacteria from osmotic stress (54, 55). The induction of these stress response-related genes by IAA suggests that IAA serves as a signal to PtoDC3000 to upregulate genes that help them adjust to stressful conditions.
TABLE 4.
Stress response-related genes (COG V) regulated by IAA
| Locus no. | Known or predicted function | Gene name | Fold changea |
|---|---|---|---|
| PSPTO_0443 | Choline dehydrogenase (glycine betaine synthesis) | betA | 3.33 |
| PSPTO_0484 | Stress response kinase A | srkA | −2.58 |
| PSPTO_1243 | GDP-mannose 6-dehydrogenase AlgD | algD | 2.06 |
| PSPTO_1667 | Universal stress protein family | 2.57 | |
| PSPTO_1767 b | Organic hydroperoxide resistance protein | ohr | 3.81 |
| PSPTO_4530 b | Catalase/peroxidase HPI | katG | 2.41 |
| PSPTO_4844 | DNA-damage-inducible protein F | dinF | 2.56 |
Fold change at 30 min posttransfer to HDM.
Analyzed by RT-qPCR in culture. Genes in boldface were also analyzed in planta.
Genes encoding efflux pumps and other transport-related proteins.
Phytopathogens, like other microorganisms, have developed various mechanisms to resist the toxic effects of antimicrobial compounds, including using efflux pumps (56, 57). Plants produce a wide range of secondary metabolites with antimicrobial activity (58, 59), and the ability to efflux these compounds likely contributes to a pathogen’s ability to colonize host tissue. Bacteria have evolved five different structural groups of multidrug resistance (MDR) efflux pump transporters: the RND, the small multidrug resistance (SMR), the multiantimicrobial extrusion (MATE), the major facilitator superfamily (MFS), and the ATP-binding cassette (ABC) superfamilies (56, 60). Our RNA-seq data revealed that expression of several genes encoding efflux pumps was altered in PtoDC3000 following IAA treatment (Table 5). Perhaps the most interesting of these are the multidrug RND family efflux transporters (encoded by mex-sax genes). Previous findings revealed that RND efflux pumps can extrude various antimicrobial compounds and/or transport virulence factors and, thus, may play a role in plant-bacterium interactions (56, 60). For example, the RND efflux pump encoded by the mexAB-oprM operon contributes to in planta growth of several P. syringae strains, including PtoDC3000, presumably by protecting them from the toxic effects of host antimicrobial compounds (37, 42). Likewise, the mexF-saxF gene confers resistance to aliphatic isothiocyanates produced by A. thaliana and contributes to virulence in plant tissue (61, 62). Our observation that these genes are upregulated by IAA in culture is intriguing and suggests another mechanism by which IAA could promote PtoDC3000 virulence. We also observed that several other transport-related genes, primarily in the ABC transporter family, were downregulated by IAA (Table 5).
TABLE 5.
Selected efflux pump (COG U)- and transport (COG E, G, P and Q)-related genes regulated by IAA
| Locus no. | Known or predicted function | Gene name | Fold changea |
|---|---|---|---|
| Downregulated | |||
| PSPTO_0370 | MATE efflux family protein | −1.93 | |
| PSPTO_1133 | Amino acid ABC transporter permease | −3.22 | |
| PSPTO_1134 | Amino acid ABC transporter substrate-binding protein | −2.70 | |
| PSPTO_2766 | ABC transporter ATP-binding protein | −2.22 | |
| PSPTO_3716 | ABC transporter substrate-binding protein | −2.55 | |
| PSPTO_3719 | ABC transporter permease | −2.61 | |
| PSPTO_3882 | Polyamine ABC transporter | −2.95 | |
| Upregulated | |||
| PSPTO_0062 | Putative citrate transporter | 2.46 | |
| PSPTO_0068 | TonB system transport protein ExbD | exbD-1 | 2.09 |
| PSPTO_0489 | ABC transporter ATP-binding protein | 2.37 | |
| PSPTO_1217 | Outer membrane efflux protein | 11.79 | |
| PSPTO_1260 | Cyanate MFS transporter | 2.43 | |
| PSPTO_1292 | Glucose ABC transporter | 2.00 | |
| PSPTO_1826 | Arginine/ornithine ABC transporter | 2.36 | |
| PSPTO_1830 | Histidine ABC transporter ATP-binding protein | hisP | 2.37 |
| PSPTO_2557 | Phosphonates ABC transporter permease | phnE | 3.39 |
| PSPTO_2640 | l-Arabinose transporter permease protein | araH | 2.19 |
| PSPTO_2705 | Mannitol ABC transporter permease | 2.03 | |
| PSPTO_2990 | Branched-chain amino acid ABC transporter ATP-binding protein | 92.80 | |
| PSPTO_3099 | Efflux transporter, RND family, MFP subunit MexE | mexE | 3.54 |
| PSPTO_3100 c | Efflux transporter, RND family MexF/SaxF | mexF | 5.95 |
| PSPTO_3101 | Outer membrane efflux protein OprN | oprN | 8.41 |
| PSPTO_3490 | Sugar ABC transporter periplasmic sugar-binding protein | 2.21 | |
| PSPTO_3621 | Outer membrane efflux protein | 5.04 | |
| PSPTO_3748 | Multidrug resistance protein | 14.70 | |
| PSPTO_4303 c | Efflux transporter, RND family, MFP subunit MexA | mexA | 3.17 |
| PSPTO_4304 b | Efflux transporter, RND family, MexB | mexB | 2.24 |
| PSPTO_4305 | Outer membrane efflux protein OprM | oprM | 2.51 |
| PSPTO_5306 | Putrescine ABC transporter protein | 2.25 |
Transcriptomic profiling through RT-qPCR in culture.
To verify the general effect of IAA on bacterial gene expression, 19 DEGs were selected for further analysis by RT-qPCR. These selected genes included four genes downregulated by IAA, PSPTO_0371 (iaaL), PSPTO_1389 (hrcC), PSPTO_1404 (hrpL), and PSPTO_4001 (avrPto) and 15 genes upregulated by IAA, PSPTO_0905 (hopAH1), PSPTO_1336, PSPTO_1483, PSPTO_1767 (ohr), PSPTO_1873 (gntR), PSPTO_3100 (mexF), PSPTO_3549 (aefR), PSPTO_3617, PSPTO_3749, PSPTO_4233, PSPTO_4530 (katG), and PSPTO_4851. We included in these experiments three genes predicted to encode small conserved hypothetical proteins that were strongly induced by IAA at all three time points assayed (PSPTO_1824, PSPTO_2683, and PSPTO_4297) (Fig. 1D; Table S1). PtoDC3000 was grown as described for the cultures analyzed in the RNA-seq experiment. For the majority of the genes tested, the patterns of changes in expression levels in response to IAA observed by RT-qPCR were consistent with the results from RNA-seq in the RNA-seq experiments (Fig. 3 and 4). Specifically, the genes involved in T3S (avrPto, hrpL, and hrcC) were strongly induced in HDM, and this induction was significantly inhibited by IAA (Fig. 3A to C). Likewise, we confirmed that expression of iaaL was repressed by IAA (Fig. 3D). iaaL encodes an IAA amino acid-conjugating enzyme demonstrated to play a role in PtoDC3000 virulence (63).
FIG 3.
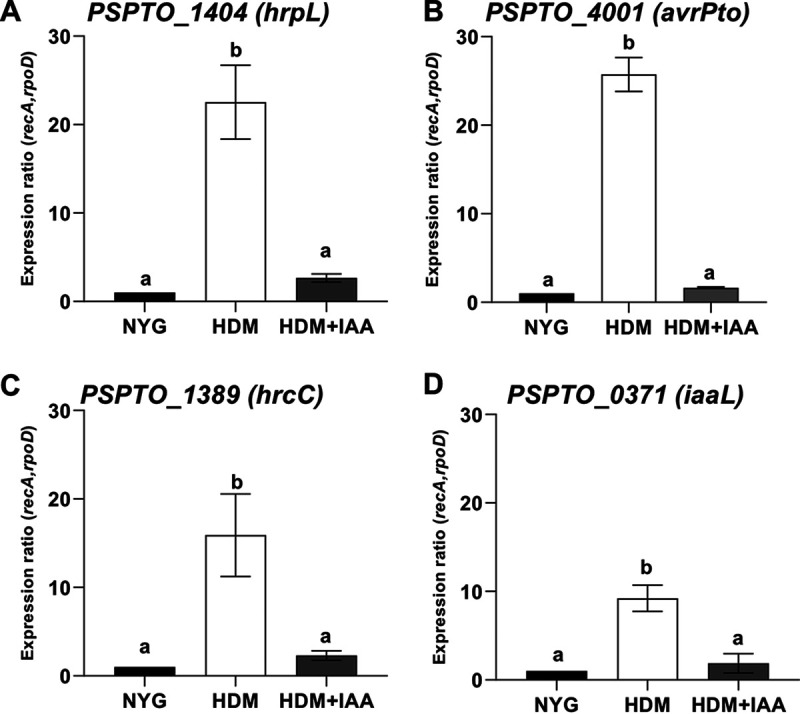
Expression of selected genes downregulated by IAA in culture using RT-qPCR. Shown is RT-qPCR analysis of expression of genes (A) PSPTO_1401 (hrpL), (B) PSPTO_4001 (avrPto), (C) PSPTO_1389 (hrcC) and (D) PSPTO_0371 (iaaL) 30 min after being transferred from NYG to HDM or to HDM containing 100 μM IAA (HDM + IAA). The expression levels in cells growing in NYG was used as a calibrator of relative expression. The relative expression was calculated using the reference genes rpoD and recA. Each data point represents the average from 3 biological replicates from one experiment, and error bars represent the standard errors of the means (SEM) between biological replicates. Results were analyzed using analysis of variance (ANOVA), followed by a Tukey’s posttest. Different letters indicate significant difference between samples with a P value of <0.05.
FIG 4.

Expression of selected genes upregulated by IAA in culture. Shown is expression, quantified by RT-qPCR, of genes PSPTO_1336 (A), PSPTO_1483 (B), PSPTO_1824 (C), PSPTO_1873 (gntR) (D), PSPTO_2683 (E), PSPTO_3100 (mexF) (F), PSPTO_3549 (aefR) (G), PSPTO_3617 (H), PSPTO_3749 (I), PSPTO_4233 (J), PSPTO_4297, (K), and PSPTO_4851 (L) 30 min after being transferred from NYG to HDM or HDM containing 100 μM IAA (HDM + IAA). The expression levels in cells growing in NYG were used as a calibrator of relative expression. The relative expression was calculated using the reference genes rpoD and recA. Each data point represents the average from 3 biological replicates from one experiment, and error bars represent the SEM between biological replicates. Results were analyzed using ANOVA, followed by a Tukey’s posttest. Different letters indicate significant difference between samples with a P value of <0.05.
The results of the RT-qPCR experiments were consistent with the RNA-seq results for 11 out of the 15 IAA upregulated genes tested. We observed that the transcripts levels for these 11 genes were present at low levels in HDM, and at significantly higher levels in HDM containing IAA (Fig. 4). Four genes, PSPTO_1336, hopAH1, katG, and ohr, did not follow the same expression pattern as that seen in the RNA-seq experiment (Fig. S1). Thus, with the exception of these four genes, the RT-qPCR results are in agreement with the RNA-seq data, demonstrating the high degree of reliability of the RNA-seq expression data obtained for PtoDC3000 in this study.
Expression of IAA-regulated genes in PtoDC3000 growing in leaf tissue.
To begin to investigate the biological relevance of the effect of IAA on PtoDC3000 gene expression, we analyzed transcripts of the selected DEGs described above in bacteria growing in planta, both in wild-type (WT) A. thaliana plants and in mutant plants that accumulate elevated levels of IAA. The tir1-1 afb1-3 afb4-8 afb5-5 (tir1 afb1 afb4 afb5) mutant line, in which four out of six TIR1/AFB family auxin coreceptors have been mutated, was previously shown to accumulate elevated levels of IAA and exhibit increased susceptibility to PtoDC3000. The increased susceptibility in these plants is due, at least in part, to the suppression of salicylic acid-dependent defenses by IAA (14). Total RNA from infected leaves was isolated at 6, 12, 24, and 48 h postinoculation (hpi), and bacterial gene expression monitored using RT-qPCR as previously described (14). In general, we observed that genes observed to be IAA-responsive in culture exhibited similar patterns of altered expression in the tir1 afb1 afb4 afb5 plants.
As expected, expression of genes involved in T3S (avrPto, hrpL, and hrcC) was strongly induced within 6 h after inoculation onto wild-type plants (Fig. 5). These observations are similar to those reported in a recent study of Nobori et al. (6) and consistent with the observation that delivery of T3E can be observed in planta by 3 hpi (64). Consistent with our in-culture results, expression of these genes was significantly reduced in tir1 afb1 afb4 afb5 mutant plants for at least one time point, suggesting that IAA also downregulates expression of these genes in planta (Fig. 3 and 5). These results are consistent with our previous observation that genes involved in T3S are downregulated by IAA during growth in planta and suggest that IAA acts as a microbial signal to turn down expression of T3S-related genes at an intermediate stage of infection. Presumably, by this stage the majority of bacteria inhabiting the apoplastic space do not require the T3S system, as they are not in direct contact with plant cells (14, 65, 66). It is important to note that although transcripts for hrpL and hrcC are reduced by 6 hpi in the tir1 afb1 afb4 afb5 mutant (Fig. 5), PtoDC3000 grows to high levels in these plants. Thus, sufficient expression of the T3S apparatus and effector proteins to support full virulence has occurred by this time. Surprisingly, we found that one T3S-associated gene, hopAH1, was induced by IAA, both in culture (Table 1) and in planta (Fig. 6D). We also observed that iaaL was expressed at lower levels in tir1 afb1 afb4 afb5 plants (Fig. 5D). One possible role for downregulation of iaaL by IAA during infection is as a mechanism for increasing free IAA levels in infected tissue.
FIG 5.

Expression in planta of selected genes downregulated by IAA in culture. Shown is expression of bacterial genes hrpL (A), avrPto (B), hrcC (C), and iaaL (D) in PtoDC3000 growing in A. thaliana WT Col-0 or tir1 afb1 afb4 afb5 mutant plants. Infected leaves were harvested 6, 12, 24, and 48 h after inoculation, and total RNA was isolated and used for RT-qPCR to quantify bacterial gene expression. RNA prepared from the PtoDC3000 cell suspension used for the inoculum was used as the calibrator for relative expression. The data shown were compiled from 2 (A and C) or 3 (B and D) independent experiments, carried out on different days. The relative expression was calculated using the reference genes recA and rpoD. Each data point is the average from 6 or 9 biological replicates, and error bars represent the SEM between biological replicates. Results were analyzed using ANOVA, followed by a Tukey’s posttest. Different letters indicate significant difference between samples with a P value of <0.05.
FIG 6.

Expression in planta of selected genes upregulated by IAA in culture. Shown is expression of bacterial genes PSPTO_4297 (A), PSPTO_3749 (B), PSPTO_1824 (C), PSPTO_0905 (hopAH1) (D), PSPTO_1767 (ohr) (E), PSPTO_1483 (F), PSPTO_3100 (mexF) (G), PSPTO_4303 (mexA) (H), and PSPTO_3549 (aefR) (I) in PtoDC3000 growing in A. thaliana WT Col-0 or tir1 afb1 afb4 afb5 mutant plants. Infected leaves were harvested 6, 12, 24, and 48 h after inoculation, and total RNA was isolated and used for RT-qPCR to quantify bacterial gene expression. RNA prepared from the PtoDC3000 cell suspension used for the inoculum was used as the calibrator for relative expression. The data shown were compiled from 2 (C, E, F, and I) or 3 (A, B, D, G, and H) independent experiments, carried out on different days. The relative expression was calculated using the reference genes recA and rpoD. Each data point is the average from 6 or 9 biological replicates, and error bars represent the SEM between biological replicates. Results were analyzed using ANOVA followed by a Tukey’s posttest. Different letters indicate significant difference between samples with a P value of <0.05.
Our in-culture expression experiments demonstrate that IAA enhances the expression of many PtoDC3000 genes hypothesized to be involved in pathogenesis. Consistent with these findings, we observed that all but two of the IAA-upregulated genes tested, PSPTO_3549 (aefR) and PSPTO_1483, are significantly induced during growth in WT plants (compared to expression levels in rich medium) and that induction of the majority of these genes occurred within ∼6 to 12 h after infiltration (Fig. 6; Fig. S2). Approximately half of the PtoDC3000 genes confirmed to be upregulated by IAA in culture also exhibited elevated levels of expression during growth in the tir1 afb1 afb4 afb5 mutant plants (Fig. 6; Fig. S2). Elevated IAA levels in planta accelerated or enhanced the expression of several genes, as induction of PSPTO_3749, PSPTO_0905 (hopAH1), and PSPTO_1767 (ohr) (Fig. 6B, D, and E) was detected earlier in tir1 afb1 afb4 afb5 mutant plants than in WT plants. Further, expression of PSPTO_1483 (Fig. 6F), which was not significantly induced in WT plants, was strongly enhanced in tir1 afb1 afb4 afb5 mutant plants (Fig. 6F). The observation of elevated expression at early time points may not be surprising given that tir1 afb1 afb4 afb5 plants have constitutively elevated IAA, whereas during PtoDC3000 infection IAA levels accumulate over time (67, 68).
Unexpectedly, we observed that expression of several genes, including PSPTO_3100 (mexF), PSPTO_4303 (mexA), and PSPTO_3549 (aefR), was not significantly affected by increased IAA levels in planta (Fig. 6G to I; Fig. S2B to E). These may represent genes that are regulated by IAA at a different stage in PtoDC3000’s life history, for example, when growing epiphytically. This hypothesis is consistent with studies in other P. syringae strains that demonstrate AefR contributes to epiphytic colonization and survival (36, 39). Further, the fact that the NDR efflux pump encoded by the mexEF-oprN operon is regulated by AefR in P. syringae tabaci (40, 41) may explain the lack of IAA induction of these genes observed inside the leaf (Fig. 5G).
Final observations.
Our global transcriptomic analysis provides a broader view of the impact of IAA on gene expression in PtoDC3000 and suggests that IAA modulates many aspects of PtoDC3000 biology. The general functional categories of genes we observed to be regulated by IAA provide insight into the possible roles IAA may play to promote virulence. (i) One role is downregulation of T3S, which is consistent with the hypothesis that IAA acts as a microbial signal for bacteria to switch from expressing virulence genes required early during the infection process to expressing genes required at intermediate stages of pathogenesis (14). This pattern of downregulation of T3S-related genes was confirmed in plants that accumulate elevated levels of IAA. (ii) Another role is downregulation of flagellum-related genes, which could be part of a strategy to evade induction of basal host defenses (e.g., PTI). (iii) A third role is stimulating expression of transcription factors and regulators that control expression of genes implicated in stress tolerance and promoting expression of several stress response-related genes. Enhancing expression of this category of genes suggests that IAA serves as a signal to upregulate factors that promote survival of PtoDC3000 under stressful conditions, including those encountered in or on plant leaves. Interestingly, our finding that several of these genes (aefR, mexE, and mexA) were upregulated by IAA in culture but not in the leaf apoplastic space suggests that IAA influences PtoDC3000 gene expression in a variety of different environments. Further analysis of these genes and their expression patterns, including mutational studies, will provide further insight into the roles auxin plays in plant-pathogen interactions.
Although many of the genes identified as IAA responsive in our in-culture experiment exhibit similar patterns of expression in plants with elevated IAA, this was not the case for all genes. Likewise, not all genes expressed in plant tissue are induced in HDM, indicating that HDM is not a perfect mimic of the environment within the apoplast. These observations highlight the importance of performing transcriptional analysis of pathogen gene expression in planta. In the future, we will carry out global transcriptomic analysis of bacteria growing in plant tissue to gain better insight into the regulation of PtoDC3000 genes by IAA during pathogenesis.
MATERIALS AND METHODS
Bacterial growth and culture conditions.
Pseudomonas syringae pv. tomato DC3000 (PtoDC3000) was routinely grown on rich medium (nutrient yeast glycerol [NYG] [69]) agar. For RNA-seq experiments, bacteria were grown overnight in NYG broth. The next day bacteria were subcultured into fresh NYG broth and grown to mid-exponential phase (optical density at 600 nm, ∼0.3). Bacterial cells were collected by centrifugation and resuspended in Hrp-derepressing medium (HDM) (12) containing 50 mM fructose and 20 μM citrate at 28°C. Indole-3-acetic acid (IAA; Sigma) in dimethyl sulfoxide (DMSO) at a concentration of 100 μM or DMSO alone was added to the cultures, and samples were collected at the indicated times.
Bacterial total RNA extraction for sequencing and RNA-seq library preparation.
Bacterial cell cultures were collected at 0, 30, 60, or 90 min after resuspension into HDM or HDM + IAA, and RNA was extracted using the Direct-zol kit (Zymo, Irvine, CA, USA) with on-column DNase treatment. Two biological replicates were included for each treatment and time point. RNA was treated again with Ambion DNase I RNase-free enzyme and purified using Zymo Research RNA Clean & Concentrator (Zymo, Irvine, CA, USA). Purity and quality of the samples were analyzed on an Agilent Bioanalyzer. rRNA was removed using Ribo-zero for Gram-negative bacteria (Illumina, Madison, WI) and purified using Zymo RNA Clean & Concentrator. RNA-Seq libraries were prepared from 50 ng of each rRNA-depleted sample using Scriptseq V2 library preparation kit (Illumina, San Diego, CA) according to the manufacturer’s instructions. Single-end barcodes were added to each sample for multiplexing using Illumina’s index set 1 primer set. Libraries were purified using the Zymo Research DNA Clean & Concentrator. The libraries were sequenced on a NextSeq 500 at the Genomics Facility at the Institute for Biotechnology, Cornell University. Two libraries representing biological replicates were prepared for each condition (IAA treated and DMSO control cultures). Eight libraries were multiplexed and sequenced in a lane of a flow cell.
Analysis of bacterial RNA-seq data.
Sequenced reads were first trimmed using Trimmomatic 0.38 (70) and then aligned to the PtoDC3000 genome (GenBank accession no. NC_004578; downloaded 23 April 2018) using Bowtie 2.2.6. Reads that aligned to multiple genomic locations were removed. Sinister and naive profiles for RNA-seq sequence data were made as described in Filiatrault et al. (71). DESeq2 1.20.0 (27) was used as previously described to analyze the magnitude and significance of the fold change between conditions (72). A false discovery rate (FDR) of 0.05 and a log2 fold change of 0.9 to −0.9 was used to generate the final list of differentially expressed transcripts.
Functional categorization of genes.
The web-based tool EggNOG 4.5 (http://eggnog-mapper.embl.de), which assigns genes to functional categories based on orthologous groups, was used to categorize differentially expressed genes by COG. Eggnog mapper was downloaded and used to annotate the PtoDC3000 genome. Lists of differentially expressed genes were categorized by COG. Further functional classification of genes was also determined by manual curation using Pseudomonas.com (73) and/or after review of the literature, especially for genes that were initially assigned to multiple distinct functional categories.
Clustering.
Gene expression clustering was carried out based on log2 fold change. A gene expression clustering map was generated by Gene Cluster 3.0 (74) using default parameters and visualized by Java TreeView (75). The data were clustered using complete linkage with uncentered correlation distance method.
Confirmation of gene expression in culture by RT-qPCR.
To confirm the effect of IAA on bacterial gene expression in culture observed in the RNA-seq experiment, we determined differential expression of a select set of genes by reverse transcriptase quantitative PCR (RT-qPCR) using total RNA isolated from bacterial cells grown in culture as previously described and harvested at 30 min after transfer to HDM or HDM + IAA (14). RNA isolated from bacteria grown in NYG was used as a calibrator of relative expression (14). Bacterial growth of these cultures was monitored prior to and for ∼12 h after the treatment.
For each PtoDC3000 sample, RNA was extracted using the RNeasy RNA isolation kit (Qiagen, Germantown, MD, USA). Bacterial samples stored at −80°C were thawed, the cells were lysed enzymatically by treatment with 0.1 ml lysozyme (1 mg/ml in TE buffer), and RNA was extracted by following the manufacturer’s instructions using the RNase-free DNase I set for on-column DNase treatment (Qiagen, Germantown, MD, USA).
For each sample, approximately 1 μg of purified RNA was used for cDNA synthesis using RevertAid premium first-strand cDNA synthesis kit (Thermo Scientific, Waltham, MA, USA) and random hexamers as primers. The primers used in this study are provided in Table S3 in the supplemental material. Control reaction mixtures lacking RT were included to confirm that the samples were not contaminated with genomic DNA. qPCR was then used to monitor the expression of the following genes: PSPTO_0371 (iaaL), PSPTO_0905 (hopAH1), PSPTO_1336, PSPTO_1389 (hrcC), PSPTO_1404 (hrpL), PSPTO_1483, PSPTO_1767 (ohr), PSPTO_1824, PSPTO_1873 (gntR), PSPTO_2683, PSPTO_3100 (mexF), PSPTO_3549 (aefR), PSPTO_3617, PSPTO_3749, PSPTO_4001 (avrPto), PSPTO_4233, PSPTO_4297, PSPTO_4851, and PSPTO_4530 (katG), using ig SYBR green qPCR 2× master mix (Intact Genomics, St. Louis, MO, USA) on a CFX Connect real-time PCR detection system (Bio-Rad, Hercules, CA, USA). The cycling conditions were 15 min at 95°C, followed by 40 cycles of 95°C for 5 s and 58°C for 30 s. In each experiment, gene expression analysis was performed on three biological replicates with three technical replicates for each. The relative expression was determined using the relative quantitation method of Pfaffl et al. as described previously (76, 77). RT-qPCR data were normalized to the reference genes PSPTO_4033 (recA) and PSPTO_0537 (rpoD), whose expression levels are not significantly altered by IAA (14). The bacterial gene expression in NYG was used as a calibrator of relative expression.
Plant material and growth conditions.
All Arabidopsis thaliana wild-type (WT) and mutant lines used in this study were in the Columbia (Col-0) background. The tir1-1 afb1-3 afb4-8 afb5-5 quadruple auxin receptor mutant used in this study has been previously described (78). Plants were grown on soil in a growth chamber with a short-day photoperiod (8 h light/16 h dark) at 21°C and 75% relative humidity, with a light intensity of ∼130 microeinsteins s−1 m−2.
To quantify bacterial growth in the plant, whole leaves were sampled 2 to 3 h after inoculation (day 0) and 3 days after inoculation, weighed to determine leaf mass, ground in 10 mM MgCl2, and then plated in serial dilutions on NYG medium with rifampin. Four to six leaves were sampled per treatment, depending on the experiment and time point.
Monitoring bacterial gene expression in planta.
Arabidopsis WT Col-0 and tir1-1 afb1-3 afb4-8 afb5-5 mutant plants were inoculated at approximately 4 to 5 weeks of age. Whole leaves were syringe infiltrated with PtoDC3000 (106 CFU ml−1) in 10 mM MgCl2 prepared from freshly growing bacterial cultures or treated with 10 mM MgCl2 (mock treatment for in planta gene expression). Approximately 100 mg of leaves were collected for RNA isolation at 6, 12, 24, and 48 h after inoculation, frozen immediately in liquid nitrogen, and stored at −80°C. A combination of protocols from the RNAprotect bacterial reagent kit (Qiagen, Germantown, MD, USA) and RNeasy plant minikit (Qiagen, Germantown, MD, USA) was used to isolate and enrich for bacterial RNAs from the samples as described by Djami-Tchatchou et al. (14). For comparison, 1.0 ml of the initial inoculum was collected by centrifugation and total RNA extracted by following the protocol described above for bacteria grown in culture. RT-qPCR was used to monitor the expression in planta of all the selected bacterial genes with the subsequent steps exactly as mentioned above for the validation in culture. In each experiment, gene expression analysis was performed on three biological replicates with three technical replicates for each. The relative expression was determined using a relative quantitation method of Pfaffl et al. as described previously (76, 77). RT-qPCR data were normalized using PSPTO_4033 (recA) and PSPTO_0537 (rpoD). The bacterial gene expression in the inoculum sample was used as a calibrator of relative expression.
Data availability.
The RNA-seq data are available in Table S1.
ACKNOWLEDGMENTS
We thank Krista Giglio for help with setting up the in-culture growth conditions for the RNA-seq experiment, Mary Ann Karp for assistance with generating the table containing COG assignments, and Chia-Yun Cynthia Lee for helpful discussion and comments on the manuscript.
This work was supported by National Science Foundation grant IOS-1645908 (to B.N.K. and M.J.F.) and USDA-ARS project 8062-21000-042-00-D (to M.J.F. and P.S.). Z.A.L. was a WUSTL BioSURF fellow.
The U.S. Department of Agriculture (USDA) is an equal opportunity provider and employer. Mention of trade names or commercial products in this publication is solely for the purposes of providing specific information and does not imply recommendation or endorsement by the USDA.
Footnotes
Supplemental material is available online only.
Contributor Information
Barbara N. Kunkel, Email: kunkel@wustl.edu.
Elizabeth Anne Shank, University of Massachusetts Medical School.
REFERENCES
- 1.Preston GM. 2000. Pseudomonas syringae pv. tomato: the right pathogen, of the right plant, at the right time. Mol Plant Pathol 1:263–275. 10.1046/j.1364-3703.2000.00036.x. [DOI] [PubMed] [Google Scholar]
- 2.Lee AH, Middleton MA, Guttman DS, Desveaux D. 2013. Phytopathogen type III effectors as probes of biological systems. Microb Biotechnol 6:230–240. 10.1111/1751-7915.12042. [DOI] [PMC free article] [PubMed] [Google Scholar]
- 3.Buttner D. 2016. Behind the lines-actions of bacterial type III effector proteins in plant cells. FEMS Microbiol Rev 40:894–937. 10.1093/femsre/fuw026. [DOI] [PMC free article] [PubMed] [Google Scholar]
- 4.Schreiber KJ, Chau-Ly IJ, Lewis JD. 2021. What the wild things do: mechanisms of plant host manipulation by bacterial type III-secreted effector proteins. Microorganisms 9:1029. 10.3390/microorganisms9051029. [DOI] [PMC free article] [PubMed] [Google Scholar]
- 5.Xin XF, Kvitko B, He SY. 2018. Pseudomonas syringae: what it takes to be a pathogen. Nat Rev Microbiol 16:316–328. 10.1038/nrmicro.2018.17. [DOI] [PMC free article] [PubMed] [Google Scholar]
- 6.Nobori T, Velasquez AC, Wu J, Kvitko BH, Kremer JM, Wang Y, He SY, Tsuda K. 2018. Transcriptome landscape of a bacterial pathogen under plant immunity. Proc Natl Acad Sci USA 115:E3055–E3064. 10.1073/pnas.1800529115. [DOI] [PMC free article] [PubMed] [Google Scholar]
- 7.Xiao Y, Heu S, Yi J, Lu Y, Hutcheson SW. 1994. Identification of a putative alternate sigma factor and characterization of a multicomponent regulatory cascade controlling the expression of Pseudomonas syringae pv. syringae Pss61 hrp and hrmA genes. J Bacteriol 176:1025–1036. 10.1128/jb.176.4.1025-1036.1994. [DOI] [PMC free article] [PubMed] [Google Scholar]
- 8.Xie YP, Shao XL, Deng X. 2019. Regulation of type III secretion system in Pseudomonas syringae. Environ Microbiol 21:4465–4477. 10.1111/1462-2920.14779. [DOI] [PubMed] [Google Scholar]
- 9.Markel E, Stodghill P, Bao Z, Myers CR, Swingle B. 2016. AlgU controls expression of virulence genes in Pseudomonas syringae pv. tomato DC3000. J Bacteriol 198:2330–2344. 10.1128/JB.00276-16. [DOI] [PMC free article] [PubMed] [Google Scholar]
- 10.Yan Q, Rogan CJ, Pang YY, Davis EW, Jr, Anderson JC. 2020. Ancient co-option of an amino acid ABC transporter locus in Pseudomonas syringae for host signal-dependent virulence gene regulation. PLoS Pathog 16:e1008680. 10.1371/journal.ppat.1008680. [DOI] [PMC free article] [PubMed] [Google Scholar]
- 11.Turner SE, Pang YY, O'Malley MR, Weisberg AJ, Fraser VN, Yan Q, Chang JH, Anderson JC. 2020. A DeoR-type transcription regulator is required for sugar-induced expression of type III secretion-encoding genes in Pseudomonas syringae pv. tomato DC3000. Mol Plant Microbe Interact 33:509–518. 10.1094/MPMI-10-19-0290-R. [DOI] [PubMed] [Google Scholar]
- 12.Anderson JC, Wan Y, Kim YM, Pasa-Tolic L, Metz TO, Peck SC. 2014. Decreased abundance of type III secretion system-inducing signals in Arabidopsis mkp1 enhances resistance against Pseudomonas syringae. Proc Natl Acad Sci USA 111:6846–6851. 10.1073/pnas.1403248111. [DOI] [PMC free article] [PubMed] [Google Scholar]
- 13.Shao XL, Tan MM, Xie YP, Yao CY, Wang TT, Huang H, Zhang YC, Ding YQ, Liu JG, Han LL, Hua CF, Wang X, Deng X. 2021. Integrated regulatory network in Pseudomonas syringae reveals dynamics of virulence. Cell Rep 34:108920. 10.1016/j.celrep.2021.108920. [DOI] [PubMed] [Google Scholar]
- 14.Djami-Tchatchou AT, Harrison GA, Harper CP, Wang R, Prigge MJ, Estelle M, Kunkel BN. 2020. Dual role of auxin in regulating plant defense and bacterial virulence gene expression during Pseudomonas syringae PtoDC3000 pathogenesis. Mol Plant Microbe Interact 33:1059–1071. 10.1094/MPMI-02-20-0047-R. [DOI] [PMC free article] [PubMed] [Google Scholar]
- 15.Abel S, Theologis A. 2010. Odyssey of auxin. Cold Spring Harb Perspect Biol 2:a004572. 10.1101/cshperspect.a004572. [DOI] [PMC free article] [PubMed] [Google Scholar]
- 16.Lavy M, Estelle M. 2016. Mechanisms of auxin signaling. Development 143:3226–3229. 10.1242/dev.131870. [DOI] [PMC free article] [PubMed] [Google Scholar]
- 17.Kazan K, Lyons R. 2014. Intervention of phytohormone pathways by pathogen effectors. Plant Cell 26:2285–2309. 10.1105/tpc.114.125419. [DOI] [PMC free article] [PubMed] [Google Scholar]
- 18.Han XW, Kahmann R. 2019. Manipulation of phytohormone pathways by effectors of filamentous plant pathogens. Front Plant Sci 10:822. 10.3389/fpls.2019.00822. [DOI] [PMC free article] [PubMed] [Google Scholar]
- 19.Kunkel BN, Harper CP. 2018. The roles of auxin during interactions between bacterial plant pathogens and their hosts. J Exp Bot 69:245–254. 10.1093/jxb/erx447. [DOI] [PubMed] [Google Scholar]
- 20.Kunkel BN, Johnson JMB. 2021. Auxin plays multiple roles during plant–pathogen interactions. Cold Spring Harb Perspect Biol 13:a040022. 10.1101/cshperspect.a040022. [DOI] [PMC free article] [PubMed] [Google Scholar]
- 21.McClerklin SA, Lee SG, Harper CP, Nwumeh R, Jez JM, Kunkel BN. 2018. Indole-3-acetaldehyde dehydrogenase-dependent auxin synthesis contributes to virulence of Pseudomonas syringae strain DC3000. PLoS Pathog 14:e1006811. 10.1371/journal.ppat.1006811. [DOI] [PMC free article] [PubMed] [Google Scholar]
- 22.Yuan Z-C, Haudecoeur E, Faure D, Kerr KF, Nester EW. 2008. Comparative transcriptome analysis of Agrobacterium tumefaciens in response to plant signal salicylic acid, indole-3-acetic acid and gamma-amino butyric acid reveals signalling cross-talk and Agrobacterium-plant co-evolution. Cell Microbiol 10:2339–2354. 10.1111/j.1462-5822.2008.01215.x. [DOI] [PubMed] [Google Scholar]
- 23.Yang S, Zhang Q, Guo J, Charkowski AO, Glick BR, Ibekwe AM, Cooksey DA, Yang C-H. 2007. Global effect of indole-3-acetic acid biosynthesis on multiple virulence factors of Erwinia chrysanthemi 3937. Appl Environ Microbiol 73:1079–1088. 10.1128/AEM.01770-06. [DOI] [PMC free article] [PubMed] [Google Scholar]
- 24.Spaepen S, Das F, Luyten E, Michiels J, Vanderleyden J. 2009. Research letter: indole-3-acetic acid-regulated genes in Rhizobium etli CNPAF512. FEMS Microbiol Lett 291:195–200. 10.1111/j.1574-6968.2008.01453.x. [DOI] [PubMed] [Google Scholar]
- 25.Van Puyvelde S, Cloots L, Engelen K, Das F, Marchal K, Vanderleyden J, Spaepen S. 2011. Transcriptome analysis of the rhizosphere bacterium Azospirillum brasilense reveals an extensive auxin response. Microb Ecol 61:723–728. 10.1007/s00248-011-9819-6. [DOI] [PubMed] [Google Scholar]
- 26.Huynh TV, Dahlbeck D, Staskawicz BJ. 1989. Bacterial blight of soybean: regulation of a pathogen gene determining host cultivar specificity. Science 245:1374–1377. 10.1126/science.2781284. [DOI] [PubMed] [Google Scholar]
- 27.Love MI, Huber W, Anders S. 2014. Moderated estimation of fold change and dispersion for RNA-seq data with DESeq2. Genome Biol 15:550. 10.1186/s13059-014-0550-8. [DOI] [PMC free article] [PubMed] [Google Scholar]
- 28.Tatusov RL, Galperin MY, Natale DA, Koonin EV. 2000. The COG database: a tool for genome-scale analysis of protein functions and evolution. Nucleic Acids Res 28:33–36. 10.1093/nar/28.1.33. [DOI] [PMC free article] [PubMed] [Google Scholar]
- 29.Schechter LM, Vencato M, Jordan KL, Schneider SE, Schneider DJ, Collmer A. 2006. Multiple approaches to a complete inventory of Pseudomonas syringae pv. tomato DC3000 type III secretion system effector proteins. Mol Plant Microbe Interact 19:1180–1192. 10.1094/MPMI-19-1180. [DOI] [PubMed] [Google Scholar]
- 30.Bao ZM, Wei HL, Ma X, Swingle B. 2020. Pseudomonas syringae AlgU downregulates flagellin gene expression, helping evade plant immunity. J Bacteriol 202:e00418-19. 10.1128/JB.00418-19. [DOI] [PMC free article] [PubMed] [Google Scholar]
- 31.Felix G, Duran JD, Volko S, Boller T. 1999. Plants have a sensitive perception system for the most conserved domain of bacterial flagellin. Plant J 18:265–276. 10.1046/j.1365-313x.1999.00265.x. [DOI] [PubMed] [Google Scholar]
- 32.Soby S, Kirkpatrick B, Kosuge T. 1991. Chemotaxis of Pseudomonas syringae subsp savastanoi virulence mutants. Appl Environ Microbiol 57:2918–2920. 10.1128/aem.57.10.2918-2920.1991. [DOI] [PMC free article] [PubMed] [Google Scholar]
- 33.Nogales J, Vargas P, Farias GA, Olmedilla A, Juan SJ, Gallegos MT. 2015. FleQ coordinates flagellum-dependent and -independent motilities in Pseudomonas syringae pv. tomato DC3000. Appl Environ Microbiol 81:7533–7545. 10.1128/AEM.01798-15. [DOI] [PMC free article] [PubMed] [Google Scholar]
- 34.Deochand DK, Grove A. 2017. MarR family transcription factors: dynamic variations on a common scaffold. Crit Rev Biochem Mol Biol 52:595–613. 10.1080/10409238.2017.1344612. [DOI] [PubMed] [Google Scholar]
- 35.Cuthbertson L, Nodwell JR. 2013. The TetR family of regulators. Microbiol Mol Biol Rev 77:440–475. 10.1128/MMBR.00018-13. [DOI] [PMC free article] [PubMed] [Google Scholar]
- 36.Quinones B, Pujol CJ, Lindow SE. 2004. Regulation of AHL production and its contribution to epiphytic fitness in Pseudomonas syringae. Mol Plant Microbe Interact 17:521–531. 10.1094/MPMI.2004.17.5.521. [DOI] [PubMed] [Google Scholar]
- 37.Stoitsova SO, Braun Y, Ullrich MS, Weingart H. 2008. Characterization of the RND-type multidrug efflux pump MexAB-OprM of the plant pathogen Pseudomonas syringae. Appl Environ Microbiol 74:3387–3393. 10.1128/AEM.02866-07. [DOI] [PMC free article] [PubMed] [Google Scholar]
- 38.Chatterjee A, Cui Y, Hasegawa H, Chatterjee AK. 2007. PsrA, the Pseudomonas sigma regulator, controls regulators of epiphytic fitness, quorum-sensing signals, and plant interactions in Pseudomonas syringae pv. tomato strain DC3000. Appl Environ Microbiol 73:3684–3694. 10.1128/AEM.02445-06. [DOI] [PMC free article] [PubMed] [Google Scholar]
- 39.Deng X, Xiao YM, Lan LF, Zhou JM, Tang XY. 2009. Pseudomonas syringae pv. phaseolicola mutants compromised for type III secretion system gene induction. Mol Plant Microbe Interact 22:964–976. 10.1094/MPMI-22-8-0964. [DOI] [PubMed] [Google Scholar]
- 40.Kawakita Y, Taguchi F, Inagaki Y, Toyoda K, Shiraishi T, Ichinose Y. 2012. Characterization of each aefR and mexT mutant in Pseudomonas syringae pv. tabaci 6605. Mol Genet Genomics 287:473–484. 10.1007/s00438-012-0693-9. [DOI] [PubMed] [Google Scholar]
- 41.Yun S, Lee JS, Do MS, Jeon YJ, Cha JY, Baik HS. 2015. Functional analysis of the aefR mutation and identification of its binding site in Pseudomonas syringae pv. tabaci 11528. Acta Biochim Biophys Sin (Shanghai) 47:938–945. 10.1093/abbs/gmv091. [DOI] [PubMed] [Google Scholar]
- 42.Vargas P, Felipe A, Michan C, Gallegos MT. 2011. Induction of Pseudomonas syringae pv. tomato DC3000 MexAB-OprM multidrug efflux pump by flavonoids is mediated by the repressor PmeR. Mol Plant Microbe Interact 24:1207–1219. 10.1094/MPMI-03-11-0077. [DOI] [PubMed] [Google Scholar]
- 43.Han JT, Li DY, Zhang MY, Yu XQ, Jia XX, Xu H, Yan X, Jia WJ, Niu SM, Kempher ML, Tao XY, He YX. 2021. EmhR is an indole-sensing transcriptional regulator responsible for the indole-induced antibiotic tolerance in Pseudomonas fluorescens. Environ Microbiol 23:2054–2069. 10.1111/1462-2920.15354. [DOI] [PubMed] [Google Scholar]
- 44.Vijayakumar SRV, Kirchhof MG, Patten CL, Schellhorn HE. 2004. RpoS-regulated genes of Escherichia coli identified by random lacZ fusion mutagenesis. J Bacteriol 186:8499–8507. 10.1128/JB.186.24.8499-8507.2004. [DOI] [PMC free article] [PubMed] [Google Scholar]
- 45.Park SH, Butcher BG, Anderson Z, Pellegrini N, Bao ZM, D'Amico K, Filiatrault MJ. 2013. Analysis of the small RNA P16/RgsA in the plant pathogen Pseudomonas syringae pv. tomato strain DC3000. Microbiology (Reading) 159:296–306. 10.1099/mic.0.063826-0. [DOI] [PMC free article] [PubMed] [Google Scholar]
- 46.Filiatrault MJ, Stodghill PV, Wilson J, Butcher BG, Chen H, Myers CR, Cartinhour SW. 2013. CrcZ and CrcX regulate carbon source utilization in Pseudomonas syringae pathovar tomato strain DC3000. RNA Biol 10:245–255. 10.4161/rna.23019. [DOI] [PMC free article] [PubMed] [Google Scholar]
- 47.Chakravarthy S, Butcher BG, Liu YY, D'Amico K, Coster M, Filiatrault MJ. 2017. Virulence of Pseudomons syringae pv. tomato DC3000 is influenced by the catabolite repression control protein Crc. Mol Plant Microbe Interact 30:283–294. 10.1094/MPMI-09-16-0196-R. [DOI] [PubMed] [Google Scholar]
- 48.Ferreiro MD, Nogales J, Farias GA, Olmedilla A, Sanjuan J, Gallegos MT. 2018. Multiple CsrA proteins control key virulence traits in Pseudomonas syringae pv. tomato DC3000. Mol Plant Microbe Interact 31:525–536. 10.1094/MPMI-09-17-0232-R. [DOI] [PubMed] [Google Scholar]
- 49.Ferreiro MD, Behrmann LV, Corral A, Nogales J, Gallegos MT. 2021. Exploring the expression and functionality of the rsm sRNAs in Pseudomonas syringae pv. tomato DC3000. RNA Biol 23:1–26. 10.1080/15476286.2020.1871217. [DOI] [PMC free article] [PubMed] [Google Scholar]
- 50.Liu J, Yu MH, Ge YX, Tian YL, Hu BS, Zhao YF. 2021. The RsmA RNA-binding proteins in Pseudomonas syringae exhibit distinct and overlapping roles in modulating virulence and survival under different nutritional conditions. Front Plant Sci 12:637595. 10.3389/fpls.2021.637595. [DOI] [PMC free article] [PubMed] [Google Scholar]
- 51.Dubbs JM, Mongkolsuk S. 2007. Peroxiredoxins in bacterial antioxidant defense, p 143–193. In Flohé L, Harris JR (ed), Peroxiredoxin systems: structures and functions. Springer, Dordrecht, Netherlands. 10.1007/978-1-4020-6051-9_7. [DOI] [PubMed] [Google Scholar]
- 52.Guo M, Block A, Bryan CD, Becker DF, Alfano JR. 2012. Pseudomonas syringae catalases are collectively required for plant pathogenesis. J Bacteriol 194:5054–5064. 10.1128/JB.00999-12. [DOI] [PMC free article] [PubMed] [Google Scholar]
- 53.Butcher BG, Bao ZM, Wilson J, Stodghill P, Swingle B, Filiatrault M, Schneider D, Cartinhour S. 2017. The ECF sigma factor, PSPTO_1043, in Pseudomonas syringae pv. tomato DC3000 is induced by oxidative stress and regulates genes involved in oxidative stress response. PLoS One 12:e0180340. 10.1371/journal.pone.0180340. [DOI] [PMC free article] [PubMed] [Google Scholar]
- 54.MuhammadiAhmed N. 2007. Genetics of bacterial alginate: alginate genes distribution, organization and biosynthesis in bacteria. Curr Genomics 8:191–202. 10.2174/138920207780833810. [DOI] [PMC free article] [PubMed] [Google Scholar]
- 55.Sleator RD, Hill C. 2002. Bacterial osmoadaptation: the role of osmolytes in bacterial stress and virulence. FEMS Microbiol Rev 26:49–71. 10.1111/j.1574-6976.2002.tb00598.x. [DOI] [PubMed] [Google Scholar]
- 56.Blanco P, Hernando-Amado S, Reales-Calderon JA, Corona F, Lira F, Alcalde-Rico M, Bernardini A, Sanchez MB, Martinez JL. 2016. Bacterial multidrug efflux pumps: much more than antibiotic resistance determinants. Microorganisms 4:14. 10.3390/microorganisms4010014. [DOI] [PMC free article] [PubMed] [Google Scholar]
- 57.Alvarez-Ortega C, Olivares J, Martinez JL. 2013. RND multidrug efflux pumps: what are they good for? Front Microbiol 4:7. 10.3389/fmicb.2013.00007. [DOI] [PMC free article] [PubMed] [Google Scholar]
- 58.Dixon RA. 2001. Natural products and plant disease resistance. Nature 411:843–847. 10.1038/35081178. [DOI] [PubMed] [Google Scholar]
- 59.Piasecka A, Jedrzejczak-Rey N, Bednarek P. 2015. Secondary metabolites in plant innate immunity: conserved function of divergent chemicals. New Phytol 206:948–964. 10.1111/nph.13325. [DOI] [PubMed] [Google Scholar]
- 60.Alcalde-Rico M, Hernando-Amado S, Blanco P, Martinez JL. 2016. Multidrug efflux pumps at the crossroad between antibiotic resistance and bacterial virulence. Front Microbiol 7:1483. 10.3389/fmicb.2016.01483. [DOI] [PMC free article] [PubMed] [Google Scholar]
- 61.Fan J, Crooks C, Creissen G, Hill L, Fairhurst S, Doerner P, Lamb C. 2011. Pseudomonas sax genes overcome aliphatic isothiocyanate-mediated non-host resistance in Arabidopsis. Science 331:1185–1188. 10.1126/science.1199707. [DOI] [PubMed] [Google Scholar]
- 62.Ichinose Y, Nishimura T, Harada M, Kashiwagi R, Yamamoto M, Noutoshi Y, Toyoda K, Taguchi F, Takemoto D, Matsui H. 2020. Role of two sets of RND-type multidrug efflux pump transporter genes, mexAB-oprM and mexEF-oprN, in virulence of Pseudomonas syringae pv. tabaci 6605. Plant Pathol J 36:148–156. 10.5423/PPJ.OA.11.2019.0273. [DOI] [PMC free article] [PubMed] [Google Scholar]
- 63.Castillo-Lizardo MG, Aragon IM, Carvajal V, Matas IM, Perez-Bueno ML, Gallegos MT, Baron M, Ramos C. 2015. Contribution of the non-effector members of the HrpL regulon, iaaL and matE, to the virulence of Pseudomonas syringae pv. tomato DC3000 in tomato plants. BMC Microbiol 15:165. 10.1186/s12866-015-0503-8. [DOI] [PMC free article] [PubMed] [Google Scholar]
- 64.Park E, Lee HY, Woo J, Choi D, Dinesh-Kumar SP. 2017. Spatiotemporal monitoring of Pseudomonas syringae effectors via type III secretion using split fluorescent protein fragments. Plant Cell 29:1571–1584. 10.1105/tpc.17.00047. [DOI] [PMC free article] [PubMed] [Google Scholar]
- 65.Misas-Villamil JC, Kolodziejek I, van der Hoorn RA. 2011. Pseudomonas syringae colonizes distant tissues in Nicotiana benthamiana through xylem vessels. Plant J 67:774–782. 10.1111/j.1365-313X.2011.04632.x. [DOI] [PubMed] [Google Scholar]
- 66.McAtee PA, Brian L, Curran B, van der Linden O, Nieuwenhuizen NJ, Chen X, Henry-Kirk RA, Stroud EA, Nardozza S, Jayaraman J, Rikkerink EHA, Print CG, Allan AC, Templeton MD. 2018. Re-programming of Pseudomonas syringae pv. actinidiae gene expression during early stages of infection of kiwifruit. BMC Genomics 19:822. 10.1186/s12864-018-5197-5. [DOI] [PMC free article] [PubMed] [Google Scholar]
- 67.Chen Z, Agnew JL, Cohen JD, He P, Shan L, Sheen J, Kunkel BN. 2007. Pseudomonas syringae type III effector AvrRpt2 alters Arabidopsis thaliana auxin physiology. Proc Natl Acad Sci USA 104:20131–20136. 10.1073/pnas.0704901104. [DOI] [PMC free article] [PubMed] [Google Scholar]
- 68.Schmelz EA, Engelberth J, Alborn HT, O'Donnell P, Sammons M, Toshima H, Tumlinson JH, III.. 2003. Simultaneous analysis of phytohormones, phytotoxins, and volatile organic compounds in plants. Proc Natl Acad Sci USA 100:10552–10557. 10.1073/pnas.1633615100. [DOI] [PMC free article] [PubMed] [Google Scholar]
- 69.Daniels MJ, Dow JM, Osbourn AE. 1988. Molecular genetics of pathogenicity in phytopathogenic bacteria. Annu Rev Phytopathol 26:285–312. 10.1146/annurev.py.26.090188.001441. [DOI] [Google Scholar]
- 70.Bolger AM, Lohse M, Usadel B. 2014. Trimmomatic: a flexible trimmer for Illumina sequence data. Bioinformatics 30:2114–2120. 10.1093/bioinformatics/btu170. [DOI] [PMC free article] [PubMed] [Google Scholar]
- 71.Filiatrault MJ, Stodghill PV, Bronstein PA, Moll S, Lindeberg M, Grills G, Schweitzer P, Wang W, Schroth GP, Luo S, Khrebtukova I, Yang Y, Thannhauser T, Butcher BG, Cartinhour S, Schneider DJ. 2010. Transcriptome analysis of Pseudomonas syringae identifies new genes, noncoding RNAs, and antisense activity. J Bacteriol 192:2359–2372. 10.1128/JB.01445-09. [DOI] [PMC free article] [PubMed] [Google Scholar]
- 72.Fishman MR, Zhang J, Bronstein PA, Stodghill P, Filiatrault MJ. 2018. Ca2+-induced two-component system CvsSR regulates the type III secretion system and the extracytoplasmic function sigma factor AlgU in Pseudomonas syringae pv. tomato DC3000. J Bacteriol 200:e00538-17. 10.1128/JB.00538-17. [DOI] [PMC free article] [PubMed] [Google Scholar]
- 73.Winsor GL, Griffiths EJ, Lo R, Dhillon BK, Shay JA, Brinkman Fiona SL. 2016. Enhanced annotations and features for comparing thousands of Pseudomonas genomes in the Pseudomonas genome database. Nucleic Acids Res 44:D646–D653. 10.1093/nar/gkv1227. [DOI] [PMC free article] [PubMed] [Google Scholar]
- 74.de Hoon MJL, Imoto S, Nolan J, Miyano S. 2004. Open source clustering software. Bioinformatics 20:1453–1454. 10.1093/bioinformatics/bth078. [DOI] [PubMed] [Google Scholar]
- 75.Saldanha AJ. 2004. Java Treeview-extensible visualization of microarray data. Bioinformatics 20:3246–3248. 10.1093/bioinformatics/bth349. [DOI] [PubMed] [Google Scholar]
- 76.Pfaffl MW, Lange IG, Daxenberger A, Meyer HH. 2001. Tissue-specific expression pattern of estrogen receptors (ER): quantification of ER alpha and ER beta mRNA with real-time RT-PCR. APMIS 109:345–355. 10.1034/j.1600-0463.2001.090503.x. [DOI] [PubMed] [Google Scholar]
- 77.Gonzalez-Lamothe R, El Oirdi M, Brisson N, Bouarab K. 2012. The conjugated auxin indole-3-acetic acid-aspartic acid promotes plant disease development. Plant Cell 24:762–777. 10.1105/tpc.111.095190. [DOI] [PMC free article] [PubMed] [Google Scholar]
- 78.Prigge MJ, Platre M, Kadakia N, Zhang Y, Greenham K, Szutu W, Pandey BK, Bhosale RA, Bennett MJ, Busch W, Estelle M. 2020. Genetic analysis of the Arabidopsis TIR1/AFB auxin receptors reveals both overlapping and specialized functions. Elife 9:e54740. 10.7554/eLife.54740. [DOI] [PMC free article] [PubMed] [Google Scholar]
Associated Data
This section collects any data citations, data availability statements, or supplementary materials included in this article.
Supplementary Materials
Table S1. Download JB.00380-21-s0001.xlsx, XLSX file, 0.2 MB (227.9KB, xlsx)
Table S2. Download JB.00380-21-s0002.xlsx, XLSX file, 0.08 MB (82.2KB, xlsx)
Captions to Tables S1 and S2; Table S3; Fig. S1 and S2. Download JB.00380-21-s0003.pdf, PDF file, 0.3 MB (292KB, pdf)
Data Availability Statement
The RNA-seq data are available in Table S1.