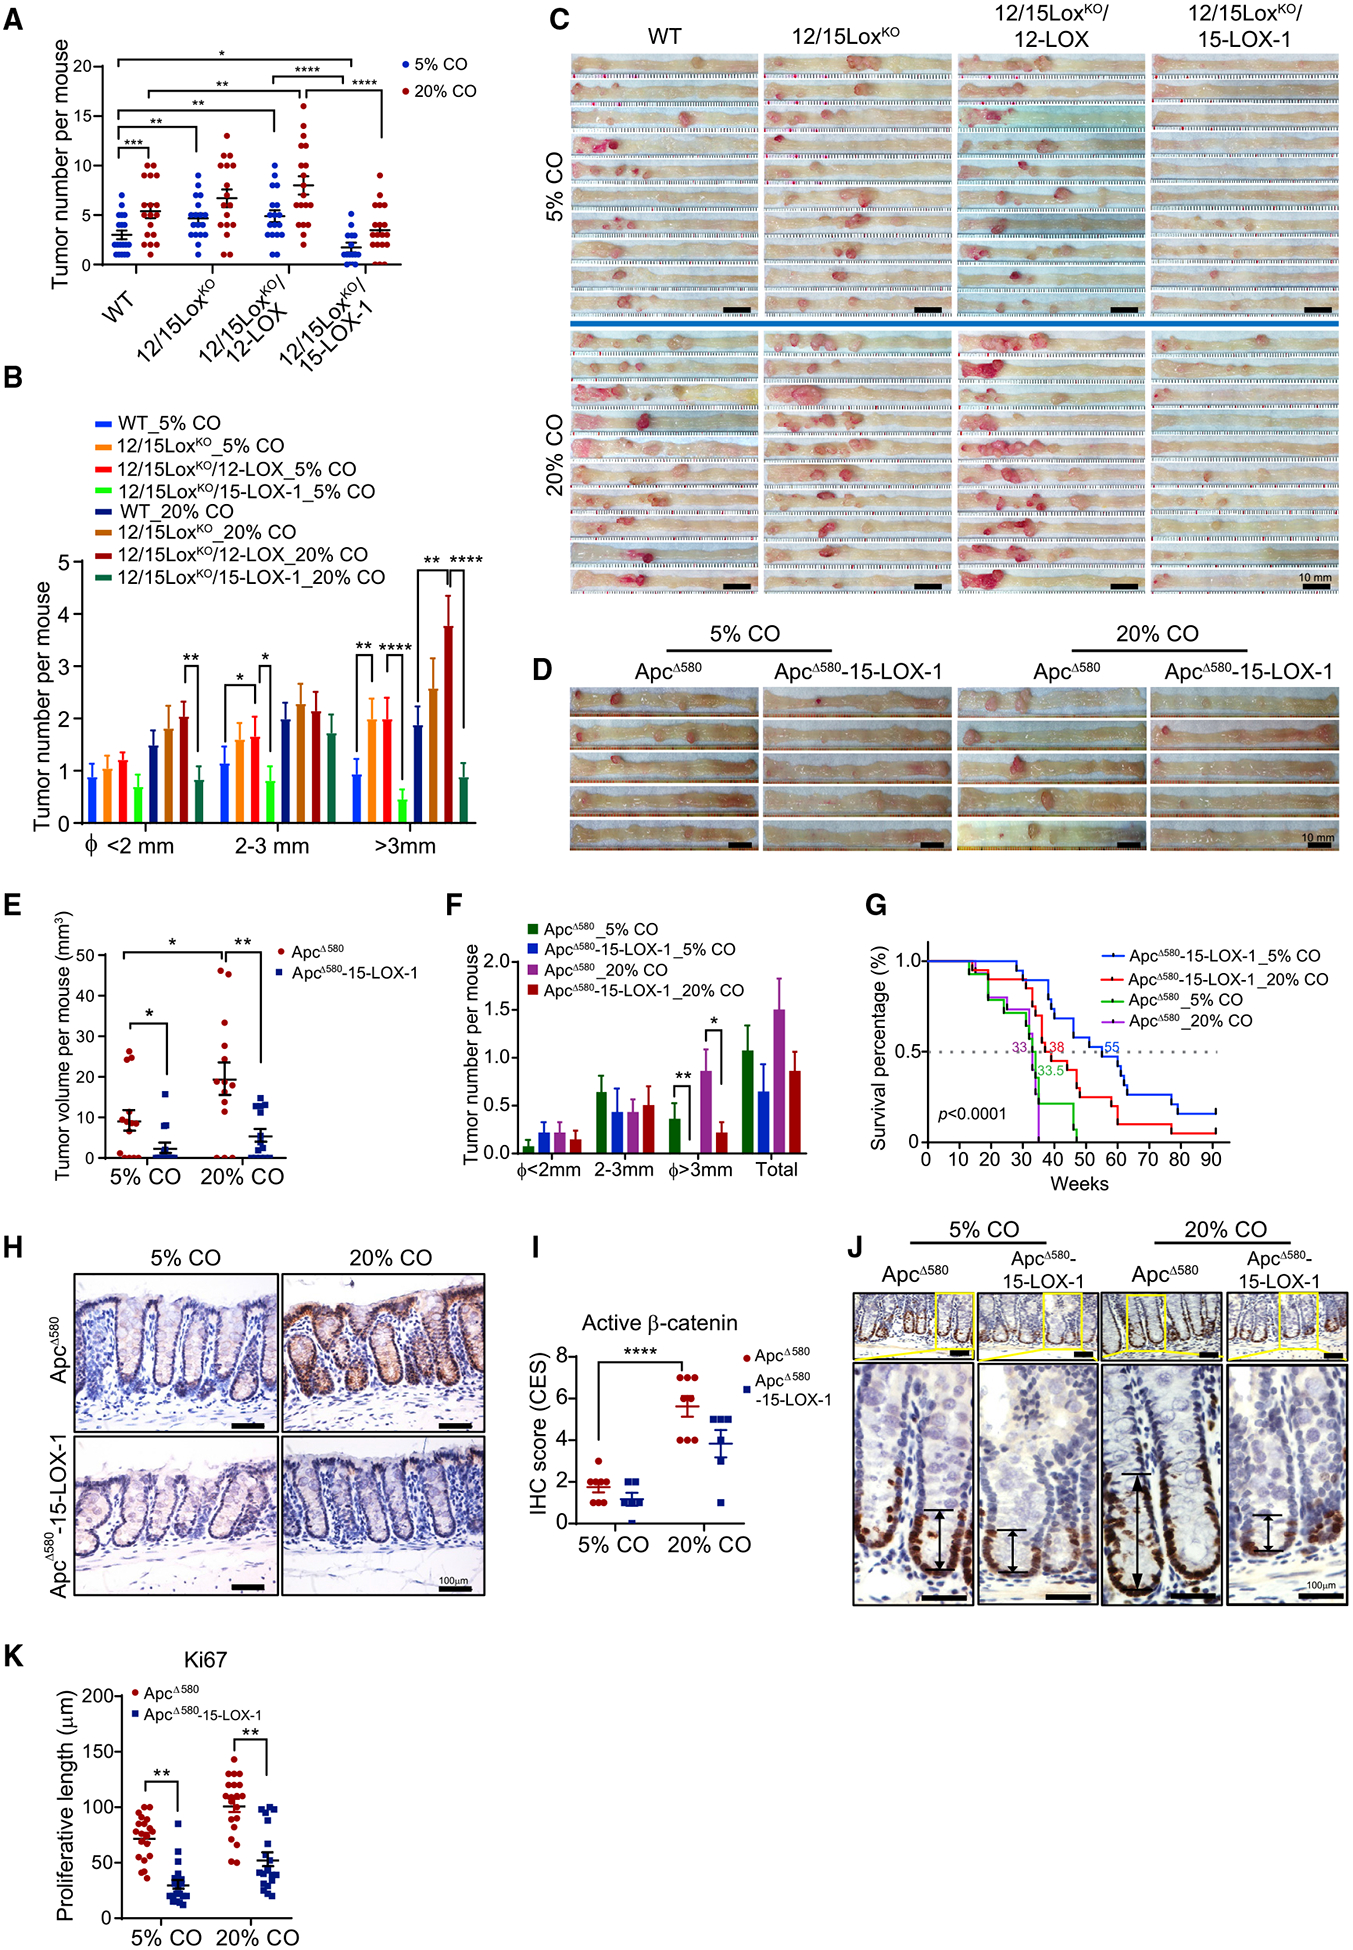
Figure 1. 15-LOX-1 Suppresses Linoleic Acid (LA) Promotion of Colorectal Carcinogenesis and Aberrant β-catenin Activation in Mice.

(A–C) 15-LOX-1 modulation of LA’s effects on azoxymethane (AOM)-induced colorectal carcinogenesis (CRC) in mice. FVB wild-type (WT), germline homozygous 12/15-LOX-knockout (12/15LoxKO), 12/15LoxKO plus villin promoter-driven 12-LOX expression in intestines (12/15LoxKO/12-LOX), and 12/15LoxKO plus villin promoter-driven 15-LOX-1 expression in intestines (12/15LoxKO/15-LOX-1) mice were fed either a 5% or a 20% corn oil (CO) diet and treated with AOM (10 mg/kg) via six weekly intraperitoneal injections to induce CRC. CRC was evaluated 20 weeks after completion of AOM injections. The number of tumors per mouse (A) and tumor size distributions (B) for the indicated groups (n = 17–19 per group) are shown. (C) Representative colon images are shown for the indicated mouse groups (n = 10 per group).
(D–F) ApcΔ580(+/−) (designated as ApcΔ580) and ApcΔ580 (+/−)-15-LOX-1(+/+) (designated as ApcΔ580-15-LOX-1) littermates at 4 weeks were fed either 5% or 20% CO and euthanized 10 weeks later (n = 14 mice per group). Representative colon images (D), colonic tumor volumes per mouse (E), and colonic tumor numbers and size distributions per mouse (F) of the indicated mouse groups are shown.
(G) Survival curves of ApcΔ580 and ApcΔ580-15-LOX-1 littermates at 4 weeks fed either 5% or 20% CO. The median survival age (weeks) for each group is shown (n = 14–20 mice per group). The survival time was calculated using the Kaplan-Meier method and compared between groups using the log rank test.
(H and I) Representative immunohistochemistry staining images (H) and quantitative composite expression scores (CES) (I) of active β-catenin expression and localization in normal colonic tissues from the indicated mouse groups as described in (D)–(F) (n = 6–8 mice per group).
(J and K) Representative immunohistochemistry staining images for cell proliferation marker Ki-67 (J) and corresponding proliferation zone lengths (K) in normal colonic tissues from the indicated mouse groups as described in (D)–(F) (30 crypts from three mice per group were counted).
Values represent mean ± SEM. *p < 0.05, **p < 0.01, ***p < 0.001, and ****p < 0.0001; two-sided Poisson (A, B, and F) and two-way ANOVA (E, I, and K).
