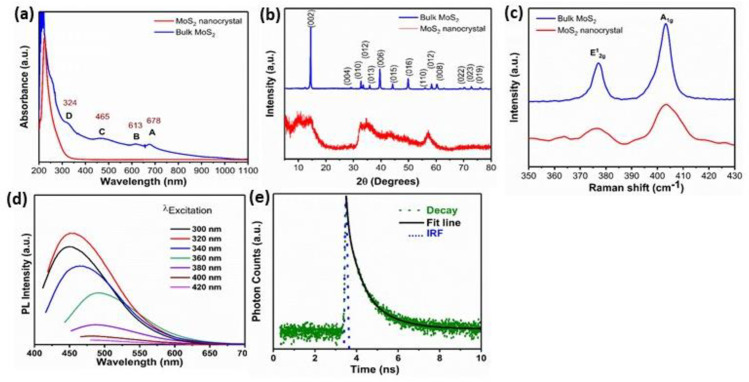
Fig 2.
(a) UV–vis spectra of the as-prepared MoS2 nanocrystals and bulk MoS2. (b) XRD spectra (c) Raman spectra (d) Emission PL spectra of the as-prepared MoS2 nanocrystals under different excitation wavelengths (e) Fluorescence lifetime of MoS2 nanocrystals. The data are fitted using a tri-exponential decay model (black line) (f) Table shows PL lifetime (τ1, τ2 and τ3), and amplitude corresponding to different lifetime.

