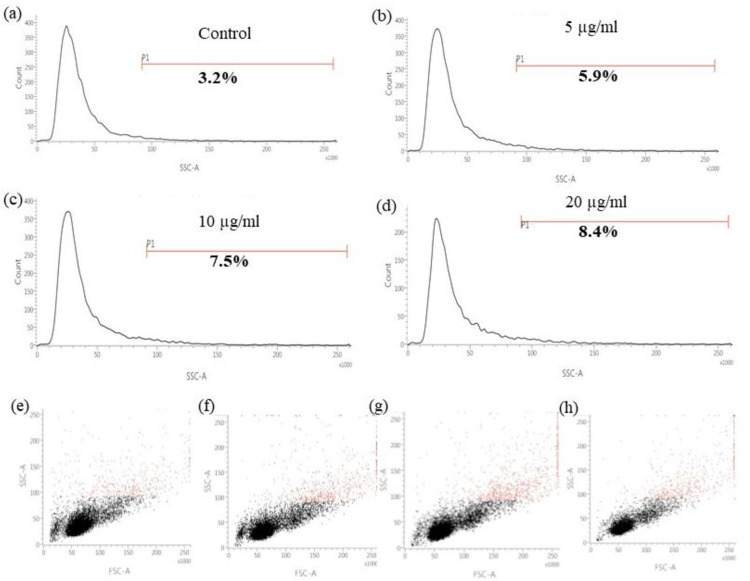
Fig 6. Uptake of MoS2 nanoparticles by A549 cells.
Side scatter (SSC) measure of (a) control, (b) 5 μg/ml, (c) 10 μg/ml and (d) 20 μg/ml subjects under flow cytometry. Flow cytometry analysis of the dot plot of mean SSC value distribution of control and different concentration of MoS2 (e) control, (f) 5 μg/ml, (g) 10 μg/ml and (h) 20 μg/ml respectively.

