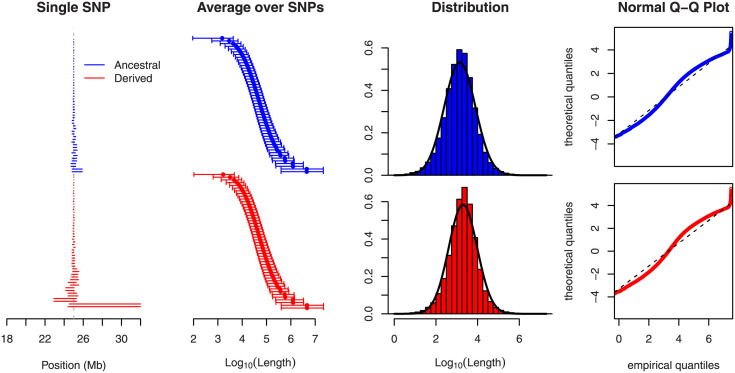
Fig 2. The length of shared haplotypes.
A region of 50 Mb was simulated in a neutrally evolving population with a sample size of n = 100. We considered only SNPs where both core alleles have a sample frequency of 50%, and we assumed that the phase is known. As in the middle panel of Fig 1, the lines in the left panel symbolize the range of the longest shared extended haplotypes, here for the most central SNP in the first simulation, ordered along the y-axis by their length. The extreme length of a single shared haplotype stands out. The middle left panel indicates that this is not an exceptional feature: here, shared haplotype lengths (restricted to those to the “right” of the focal marker) are averaged across SNPs from 100 independent simulation runs, restricted to those less than 5 Mb away from the center in order to minimize boundary effects. The ends of the bars represent 5% and 95% quantiles. For the same SNPs, the middle right panel presents length distributions of all pairwise shared haplotypes ( per SNP and allele). The distributions are overlaid with a fitted Gaussian curve. The right panel shows Q–Q plots of the distributions. Note that the largest lengths are actually capped, because in 11 simulation runs, shared haplotypes reached the chromosomal boundary.

