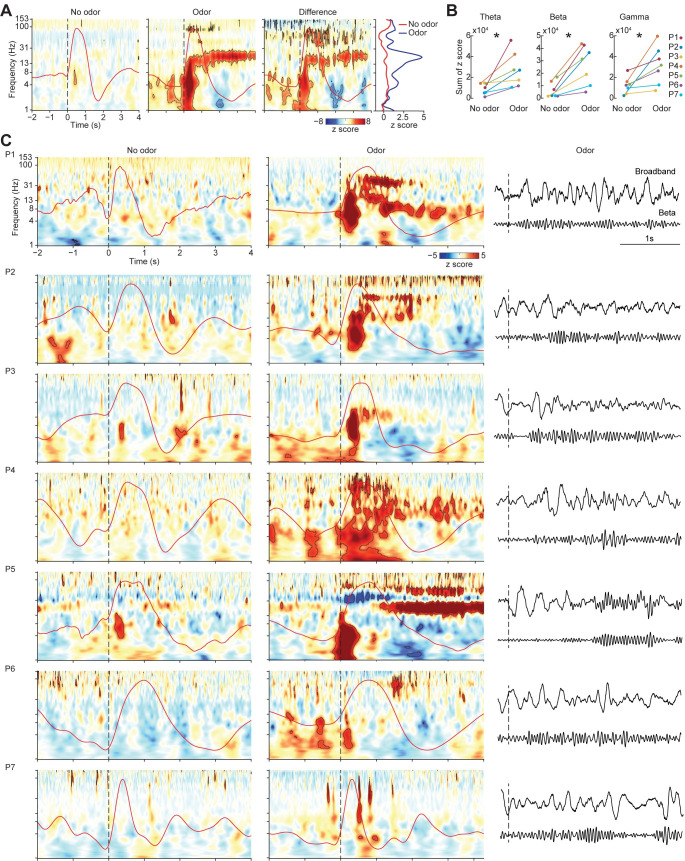
Fig 2. Odor induces theta, beta, and gamma oscillations in human piriform cortex.
(A) Results from combined analysis showing z-normalized amplitude spectrograms for no-odor and odor conditions (left and middle panels), and the difference between the 2 conditions (right panel). Average respiratory signal is shown on each panel (overlaid red line). Dashed line represents inhale onset. For odor and no-odor spectrograms, the black contour lines indicate statistical significance of permutation tests against pre-cue baseline (P < 0.05, FDR corrected). For the difference spectrogram, the black contour lines indicate statistical significance of permutation of condition labels (P < 0.05, FDR corrected). The far-right panel shows average z scores from 0–4 s postsniff across frequencies for odor and no-odor trials. (B) Individual theta, beta, and gamma summed magnitudes over 0–2 s postsniff. Each dot represents data from a single participant, and lines connect data within the same participant. Asterisk indicates statistical significance (two-tailed paired t test; P < 0.05). (C) Z-normalized amplitude spectrograms for each participant for no-odor (left) and odor (middle) conditions, with the average respiratory signal shown on each panel (overlaid red line). Dashed lines represent inhale onset. Black contour lines indicate statistical significance of permutation tests against pre-cue baseline (P < 0.05, FDR corrected). Raw broadband and beta (13–30 Hz) time series of a representative trial is shown on the right. The source data for panels (A–C) are available in S1 Data. FDR, false discovery rate.

