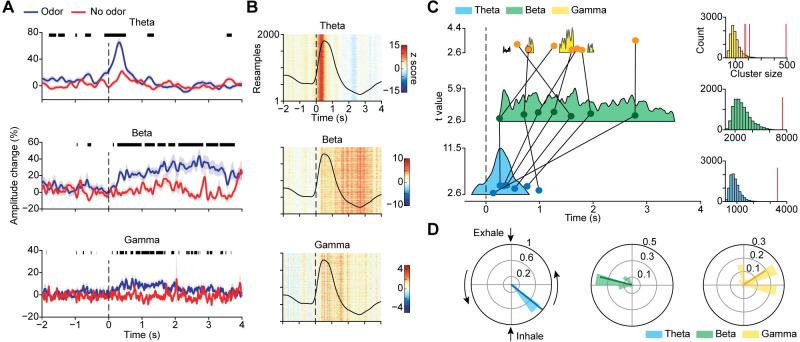
Fig 3. Odor-induced theta, beta, and gamma oscillations have different time courses relative to sniff onset.
(A) Percent-amplitude-change time series for odor (blue line) and no-odor (red line) conditions for each frequency band. Shaded areas indicate 1 standard error from the mean across all trials. Thick black lines above indicate statistically significant differences between conditions (two-tailed paired t test; P < 0.05, FDR corrected). (B) Bootstrap colormap of z-normalized amplitude for each frequency band, with results from each repetition stacked along the y-axis. Vertical stripes of consistent color indicate consistent amplitudes across subsampled sets of trials. (C) Colored shaded areas represent clusters of statistical significance of the trial-by-trial baseline-corrected amplitude time series, for each frequency band (P < 0.05, cluster-based correction). Upper boundaries of the shaded areas represent the t statistic from the one-sample t test of baseline-corrected amplitude at each time point against 0. Scales for t statistics are shown to the left of each cluster. Overlaid darker dots indicate the average timing of the bootstrapped distribution of peak amplitude occurrence for each frequency band, for each participant. Each dot represents data from 1 participant. Dots from the same participant are connected by black lines. On the right, cluster masses in relation to the permuted null distribution for each frequency band are shown, with actual values represented by the vertical red line. (D) Respiratory phase angle distributions corresponding to bootstrapped peak amplitudes for each frequency band. Scale of the polar histogram represents the probability density function of the distribution. Darker lines overlaid on the distribution indicate the mean vector of the phase distribution. Angle and radius represent averaged phase angle and PLV value respectively. The source data for panels (A–D) are available in S2 Data. FDR, false discovery rate; PLV, phase locking value.

