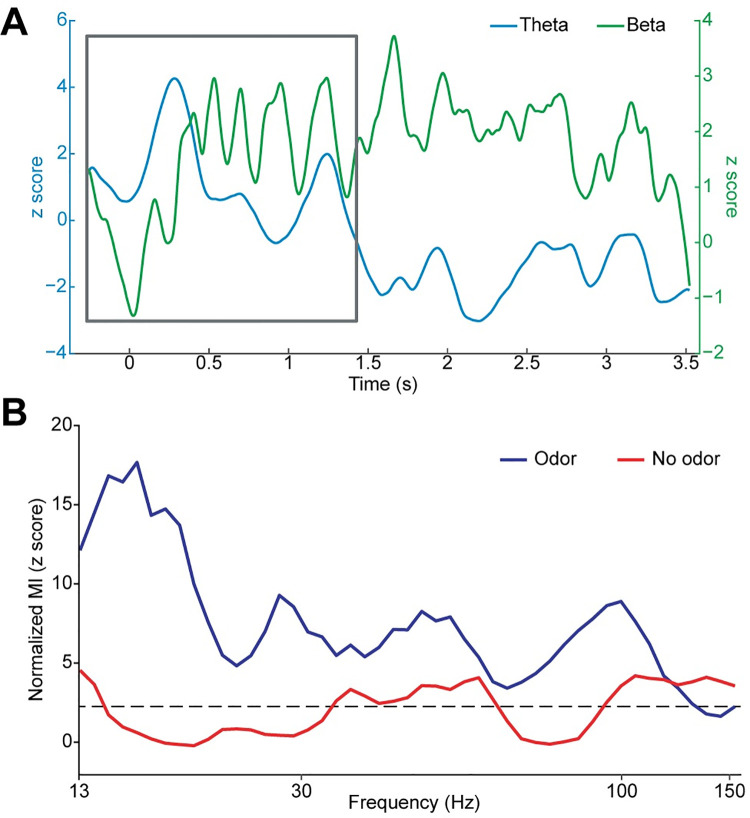
Fig 6. Theta phase modulates higher frequency amplitudes during inhale, when odor is present.
(A) Apparent rhythmic beta amplitude modulations at the theta frequency. With effects of attention subtracted out, the average z score of the amplitude of the odor responses over time is displayed for beta (green) and theta (blue) frequency bands. The overall magnitude of beta oscillations increased and decreased rhythmically with a frequency in the theta range, particularly in the first 1.5 to 2 s of the response (gray box). (B) Phase-amplitude coupling between theta phase and higher frequency amplitudes. Z-normalized MI of theta phase and higher frequency amplitudes (13 to 150 Hz), during 0–1 s postsniff for all trials in the odor and no-odor conditions. Dashed line indicates FDR threshold for significant MI (P < 0.05, FDR corrected). The source data for panels (A) and (B) are available in S4 Data. FDR, false discovery rate; MI, modulation index.

