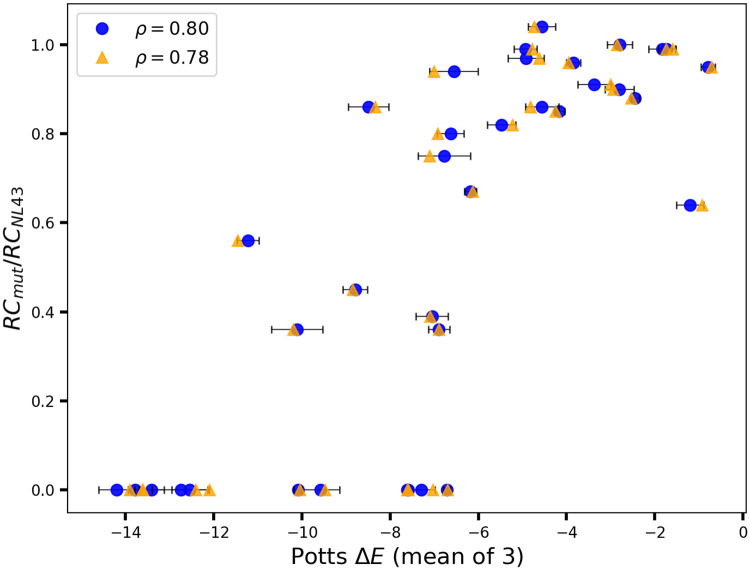
Fig 5. Error estimate in Potts model predictions of fitness.
Figure shows replicative capacity based experimental fitness measurements (from [21]) compared to Potts model predicted likelihoods of mutations in HIV-1 CA. The Potts model predicted values shown in “blue circles” correspond to the mean of 3 predictions based on jackknife tests with error bars indicating the standard deviations. Random values are then picked from within each standard deviation to represent each Potts model prediction (shown as “orange triangles”) and the corresponding effect on the correlation coefficient is observed. Spearman rank-order correlation ρ = 0.8 for mean of 3 predictions, and ρ = 0.78 for random selection of data from within the margin of error. For jackknife tests, three sets of ≈1024 weighted patient sequences are subsampled at random from the original MSA of ≈2200 weighted sequences, and new Potts models are then inferred based on each set. For comparison, the Spearman rank-order correlation is ρ = 0.85 for the original Potts model (based on an MSA of 2200 sequences) predictions compared to experimental values (Fig 5A of S1 File). Figure shows an estimate of the error associated with Potts model predictions of likelihoods of mutants stemming from sampling of sequences in the MSA and its effect on the correspondence with experimental measures of fitness.

