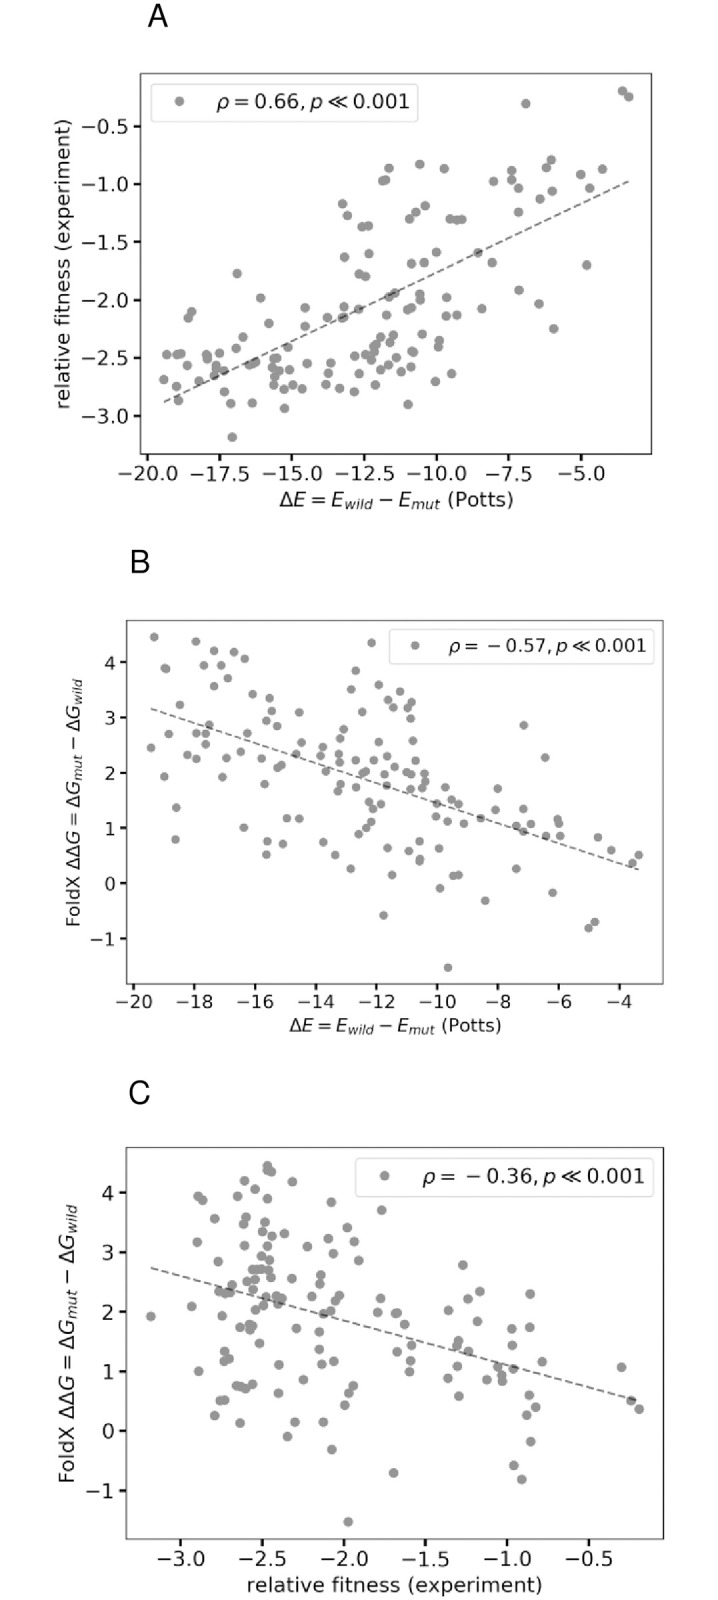
Fig 7. Potts model captures different features of the fitness landscape.

Figure shows that the Potts model predicted ΔEs can capture different features of the fitness landscape that may be orthogonal, and may not correlate well with each other. (A) Relative fitness (replicative capacity) measurements obtained from deep mutational scanning of HIV-1 variants [28] involving combinations (of three or lesser) of mutations in protease associated with resistance to (particularly second-generation) inhibitors in clinic, are compared to changes in Potts statistical energies, ΔEs with a Spearman rank-order correlation, ρ = 0.66 (p ≪ 0.001). [28] also report statistically significant correlation (|ρ| = 0.46) with a Potts model inferred using the Adaptive Cluster Expansion (ACE) algorithm. (B) FoldX predicted changes in folding energies, ΔΔGs (PDB: 3S85) of the mutations also correlate well with Potts predicted changes in statistical energies, ΔEs for the same (Spearman ρ = −0.57). The HIV-1 protease structure (PDB: 3S85) is used as reference, repaired using the RepairPDB function in the FoldX suite, and the free energy of mutants is calculated with the BuildModel function under default parameters. Changes in structural stability due to mutations correlate well with their predicted likelihoods (estimated by the Potts model ΔEs) as seen here with a Spearman rank-order correlation, ρ = −0.57 (p < 0.001) between the two. However, FoldX calculations are susceptible to small changes in structure that can be caused by the presence of small-molecule ligands, etc. For another PDB:4LL3, we still find statistically significant correlation between the two (ρ = −0.64). (C) Experimental relative fitness measurements however, do not correlate as well with FoldX predicted changes in folding energies due to the mutations (ρ = −0.36).
