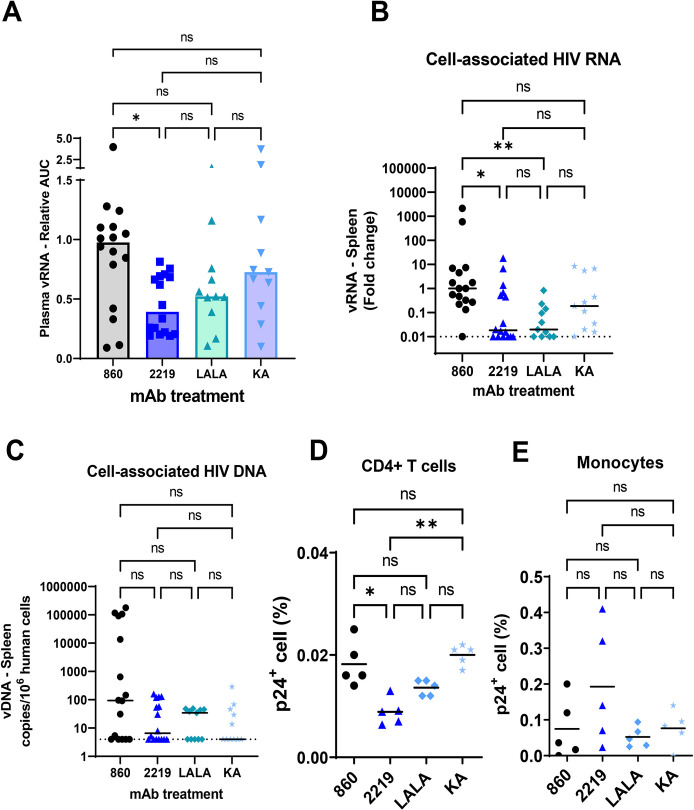
Fig 6. Virus control by passively administered 2219 WT vs LALA vs KA in humanized mice challenged with JRFL IMC.
A. Plasma vRNA loads as measured by vRNA AUC observed in individual mice that received 2219 WT or LALA or KA variants and challenged with JRFL IMC. Data are presented as relative AUC over mean AUC of the control 860 group included in each experiment. Data are compiled from experiments using 2 or 3 cohorts of mice that were generated with different HSC donors. N = 16, 16, 11 and 11 for the groups treated with 860 (irrelevant control), 2219 WT, LALA, and KA, respectively. B. Relative levels of cell-associated vRNA in the spleen collected from individual animals on the last day of experiments. Data from 2 or 3 experiments are presented as fold changes over median of the 860 group tested in each experiment. C. Relative levels of cell-associated vDNA in the spleen on the last day of experiments. Data from 2 or 3 experiments are presented as vDNA copies/106 human CD45+ cells. D-E. Percentages of p24+ cells among CD4 T cells (D) and monocytes (E). Spleen cells collected from mice in one experiment (n = 5/group) were subjected to intracellular staining with anti-p24 mAb KC57 and staining for viability markers, human CD45 (huCD45), mouse CD45 (mCD45), CD4 T cells (CD3+CD8-), and monocytes (CD3-CD11c-CD14+). Analysis was done on viable hCD45+ and mCD45- cells. Cells from mock-infected mice were used as negative controls (S5 Fig). Statistical analysis was performed using Kruskal-Wallis one-way ANOVA test with Dunn’s multiple comparison. *, p <0.05; **, <0.01; ns: not significant (p>0.05). Dotted lines: limit of detection. Bars and horizontal lines: median.

