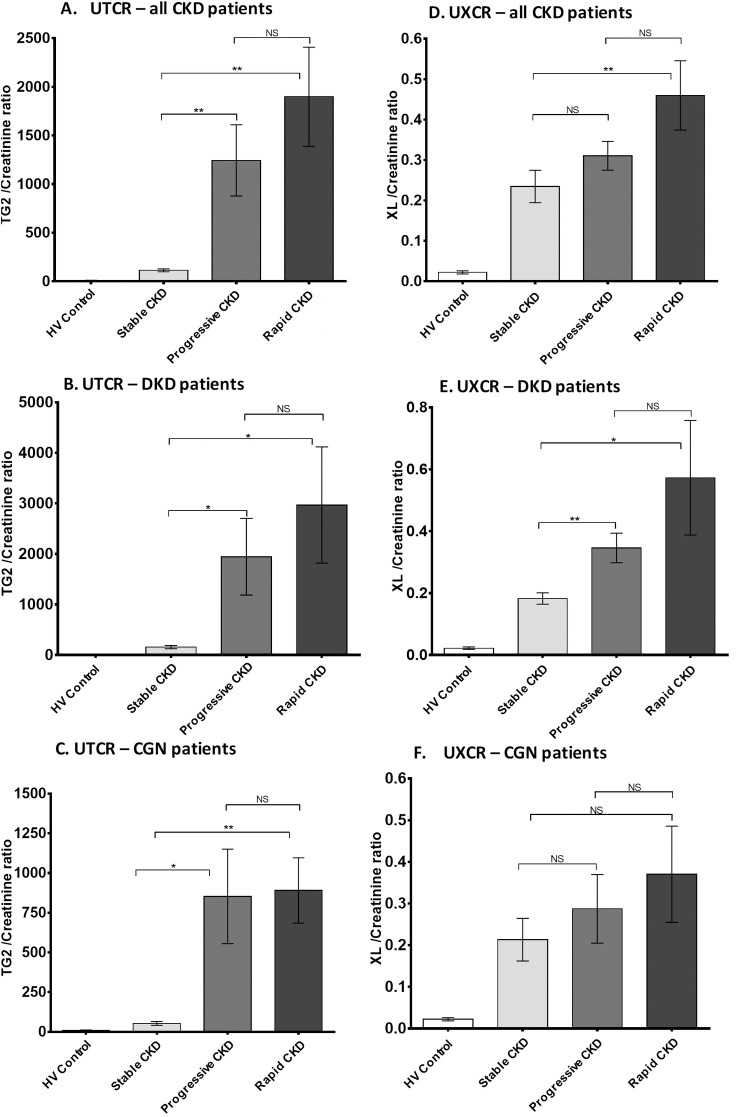
Fig 4. Urinary TG2 and ε-(γ-glutamyl)-lysine excretion in CKD patients by disease progression.
UTCR and UXCR measurements in CKD patients were subdivided into groups according to their rate of disease progression: non-progressive (rate of eGFR decline < 2 mL/min/1.73m2/year, n = 184), progressive (between 2–5 mL/min/1.73m2/year, n = 79), and rapidly progressive (> 5 mL/min/1.73m2/year, n = 29) and data presented as a bar chart in all CKD patients (A) and (D), DKD patients (B) and (E), and CGN patients (C) and (F). Statistical significance is shown by one-way ANOVA with Bonferroni post hoc test: *P < 0.05, **P < 0.01, ***P < 0.001 between non-progressive, progressive, and rapidly progressive patients. Data are mean ± SD. CGN = chronic glomerulonephritis; CKD = chronic kidney disease; DKD = diabetic kidney disease; eGFR = estimated glomerular filtrate rate; HV = healthy volunteer; NS = not statistically significant; SD = standard deviation; UTCR = urinary TG2:creatinine ratio; UXCR = urinary ε-(γ-glutamyl)-lysine:creatinine ratio; XL = ε-(γ-glutamyl)-lysine crosslink.

