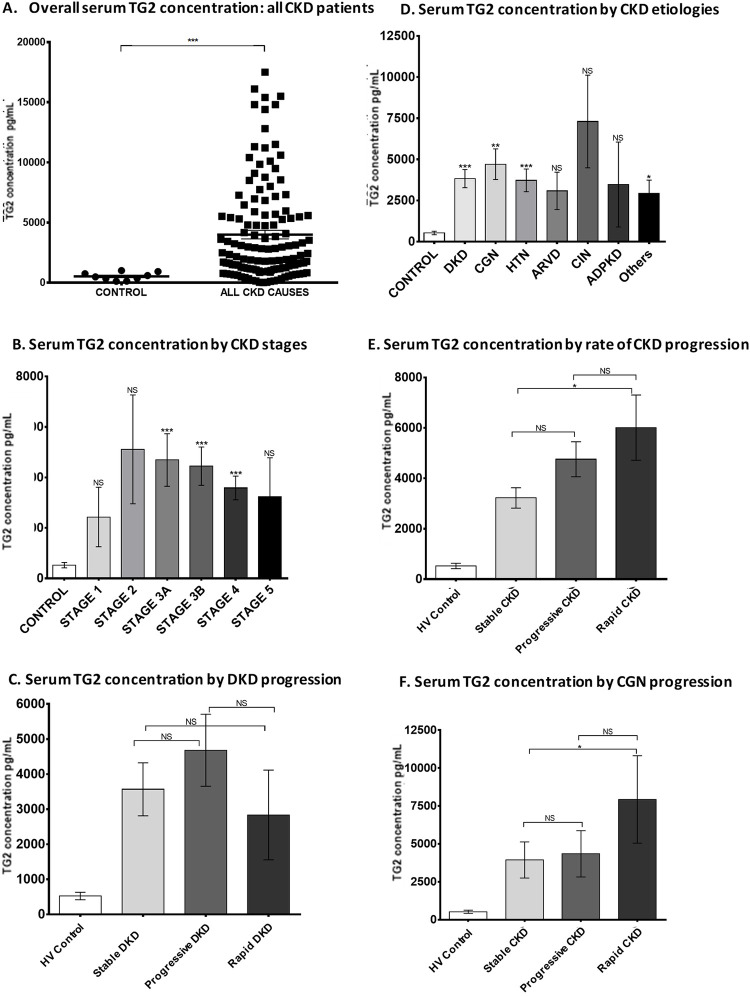
Fig 5. Serum TG2 concentration in patients with CKD.
Serum TG2 concentration was quantified by an in-house sandwich ELISA. (A) Scatter plot of serum TG2 measurements in HV (n = 9) and CKD patients (n = 130), (D) average serum TG2 concentration (pg/mL) in different types of CKD, (B) at different CKD stages, (E) by rate of CKD progression, and in the two largest groups of patients present in the cohort: (C) DKD and (F) CGN. Statistical significance was shown by one-way ANOVA with Bonferroni post-hoc test: *P < 0.05, **P < 0.01, ***P < 0.001. Data are mean ± SD. CGN = chronic glomerulonephritis; CKD = chronic kidney disease; DKD = diabetic kidney disease; ELISA = enzyme-linked immunosorbent assay; HV = healthy volunteer; NS = not statistically significant; SD = standard deviation; TG2 = transglutaminase 2.

