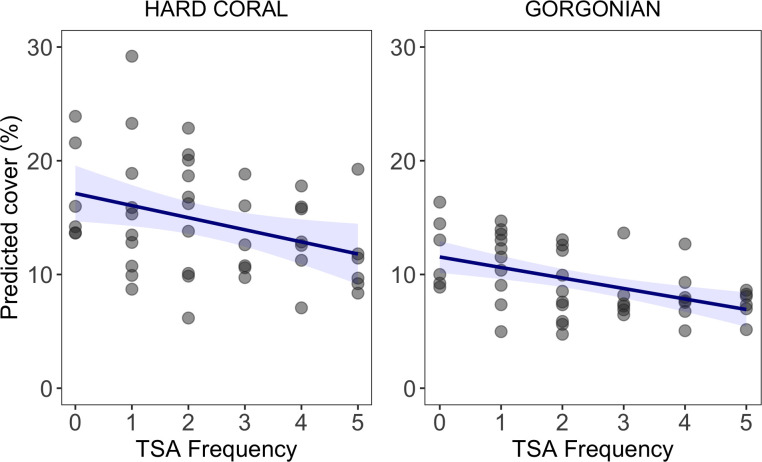
Fig 4. Effect of TSA frequency on hard-coral and gorgonian cover.
Points are predicted benthic-group cover (back-calculated from logit transformation) from a Bayesian generalized liner mixed model accounting for time, protection status, and HII. Blue lines are the fitted curves of the models and shaded areas are the 95% CIs.

