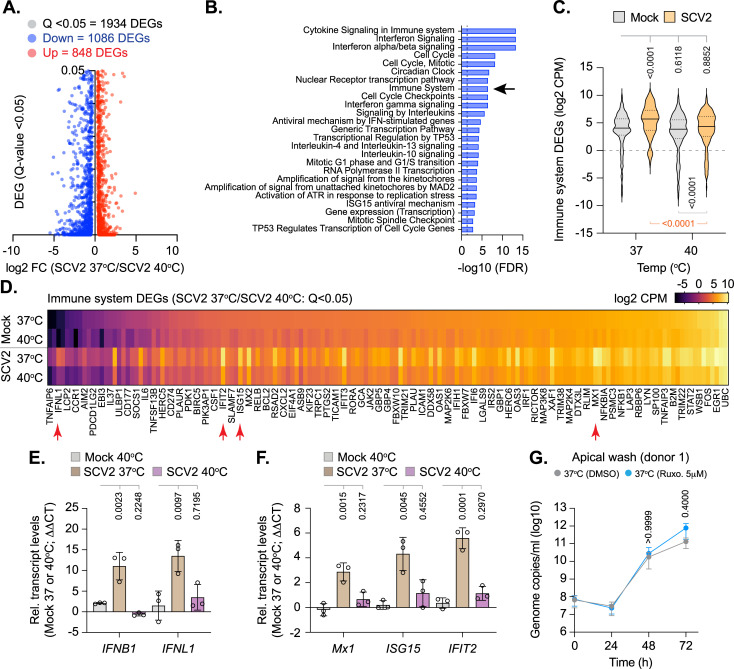
Fig 6. Elevated temperature restricts SARS-CoV-2 replication in respiratory airway cultures independently of IFN-mediated antiviral immune defenses.
Ciliated respiratory cultures differentiated from primary HBEp cells isolated from 3 independent donors (donor 1, male Caucasian aged 63 years; donor 2, Hispanic male aged 62 years; donor 3, Caucasian female aged 16 years; all nonsmokers) were incubated at 37 or 40°C for 24 h prior to mock (media) or SARS-CoV-2 (SCV2; MOI 0.05, 104 PFU/Tissue) infection. Tissues were incubated at their respective temperatures for 72 h prior to RNA extraction and RNA-Seq or RT-qPCR. (A) Scatter plots showing high confidence (Q < 0.05) DEG transcripts identified between SARS-CoV-2–infected respiratory cultures at 37 or 40°C; up-regulated DEGs, red circles; down-regulated DEGs, blue circles. (B) Reactome pathway analysis of mapped down-regulated DEGs. Top 25 down-regulated (FDR < 0.05) pathways shown (blue bars; plotted as −log10 FDR). Dotted line, threshold of significance (−log10 FDR of 0.05). (C) Expression profile (log2 CPM) of down-regulated immune system DEGs (R-HSA168256; arrow in B) relative to expression levels in mock tissue at 37 or 40°C. Black line, median; dotted lines, fifth and 95th percentile range; p-values shown, one-way ANOVA (top), paired two-tailed t test (bottom). (D) Expression levels (log2 CPM) of immune system DEGs (identified in B, black arrow) relative to mock at 37 or 40°C. Every second gene labeled. Red arrows highlight genes chosen for RT-qPCR validation. (A to D) RNA-Seq data derived from RNA isolated from 3 donors (donors 1 to 3) per sample condition derived from 3 independent experiments per donor. (E/F) RT-qPCR (ΔΔCT) quantitation of IFN (IFNB1 and IFNL1) or ISG (Mx1, ISG15, and IFIT2) transcript levels within mock or SARS-CoV-2–infected respiratory cultures derived from 3 independent donors (transcript values normalized to GAPDH per sample condition). N ≥ 3 tissues per donor per condition derived from 3 independent biological experiments. Means and SD shown; all data points shown; p-values shown, one-way ANOVA. Individual ΔCT values per donor are shown in S6 Fig for donor comparison. (G) Respiratory cultures differentiated from donor 1 HBEp cells were pretreated with Ruxo (5 μM) or carrier control (DMSO) for 16 h prior to SARS-CoV-2 infection (MOI 0.05, 104 PFU/Tissue) and continued incubation at 37°C in the presence of inhibitor or carrier control. Apical washes were collected at the indicated times (h) and genome copies per ml determined RT-qPCR. N = 3 tissues per sample condition derived from 3 independent biological experiments. Means and SD shown; p-values shown, Mann–Whitney U test. Raw values presented in S8 and S9 Data. CPM, counts per million; DEG, differentially expressed gene; FDR, false discovery rate; HBEp, human bronchiolar epithelial; IFN, interferon; ISG, IFN-stimulated gene; PFU, plaque-forming unit; RT-qPCR, reverse transcription quantitative PCR; Ruxo, Ruxolitinib; SARS-CoV-2, Severe Acute Respiratory Syndrome Coronavirus 2.

