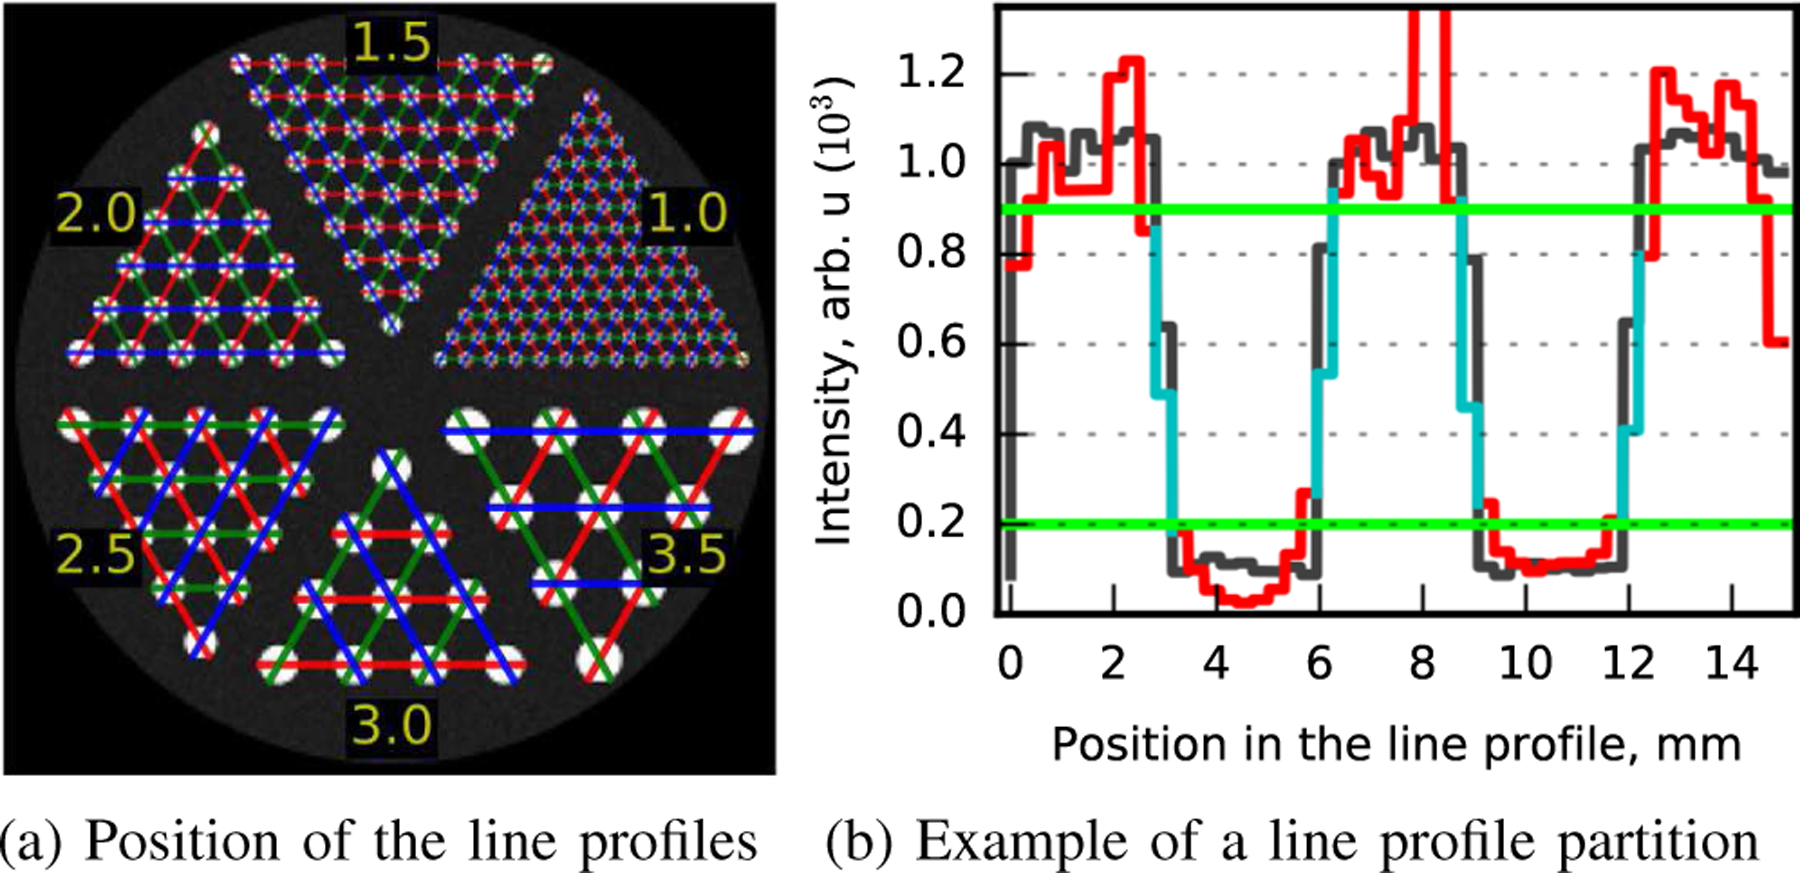
Fig. 2.

(a) Line profiles overlayed on the HotSpots phantom. The green, red and blue colors were used for better visualization. (b) Example of partition applied for peak-to-valley ratio evaluation. The black line shows the line profile for the ground truth of the reconstructed image. The green lines are the thresholds applied on the ground truth line profile to find pixels affected by partial volume effect. The red line shows the pixels extracted from the reconstructed image while the cyan line shows those that were excluded.
