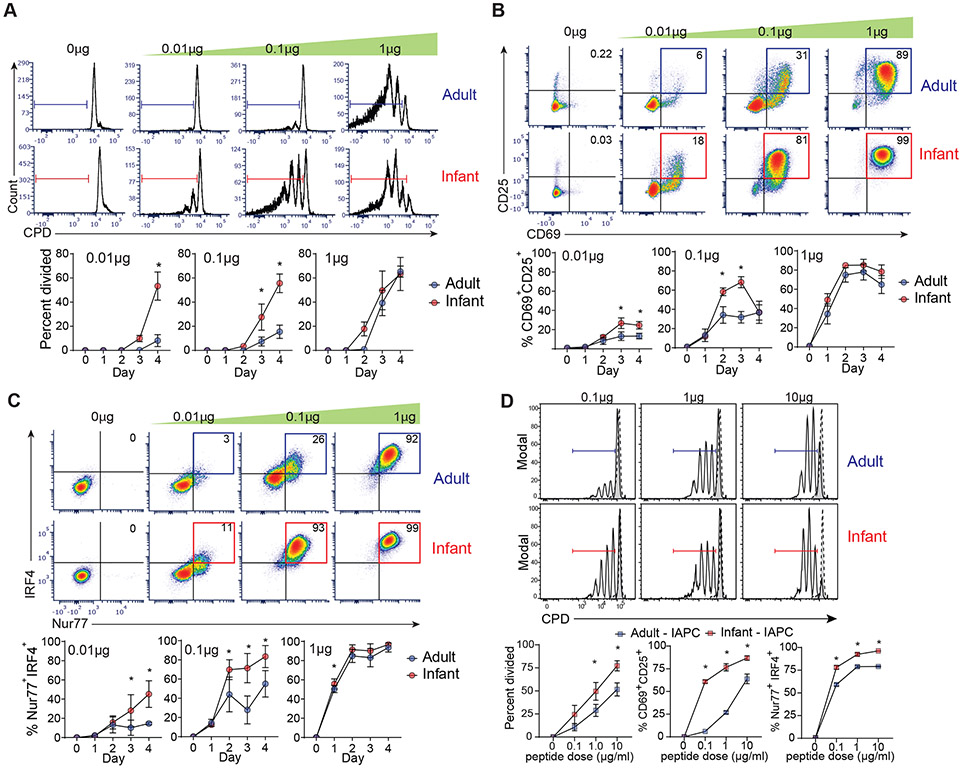
Fig. 4: Infant T cells have enhanced TCR sensitivity leading to decreased activation threshold.
Infant and adult OT-II cells were co-cultured with APC in different doses of ovalbumin peptide and harvested at 1-4 days post-stimulation (A) Proliferation of infant and adult OT-II cells to different antigen doses at day 3 post-stimulation shown in representative CPD dilution plots (top) and graphs quantifying percent divided at 1-4 days post-stimulation (bottom). Expression of CD69 and CD25 (B) and Nur77 and IRF4 (C) on infant and adult OT-II cells at day 3 post stimulation shown in representative flow cytometry plots (top) and graphs showing percent of CD69+CD25+ or Nur77+IRF4+ cells or for each dose over time (bottom). (D) (Top) Proliferation of infant and adult OT-II cells (black line) upon stimulation with infant antigen presenting cells (I-APC) at indicated peptide doses compared to unstimulated (dotted line). (Bottom) Expression of activation CD69+ CD25+, and percent Nur77+ IRF4+ expression by infant (red) and adult (blue) OT-II cells after 3 days of stimulation with I-APC at indicated doses. Data are compiled from 4 (A-C) and 2 (D) independent experiments. Statistical analysis was done using two-way ANOVA with Sidak multiple comparison testing.

