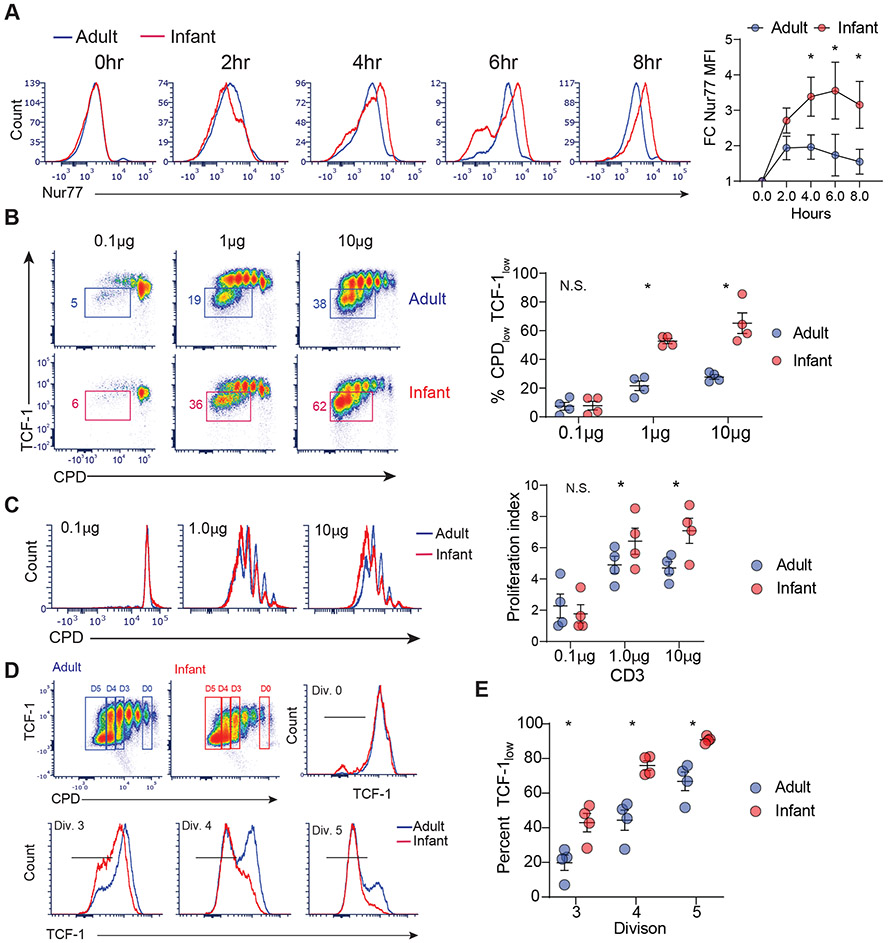
Fig. 7: Human infant T cells exhibit early TCR-coupled signaling and enhanced TCF-1 downregulation.
CD4+ naive T cells from human infant and adult lymph nodes were stimulated with anti-CD3/anti-CD28/anti-CD2 coated beads for time points indicated. (A) Expression of Nur77 in human infant and adult T cells upon stimulation at the indicated times are shown in representative flow plots (left) and a graph showing Nur77 expression as fold change (FC) relative to unstimulated control (right). (B) Expression of TCF-1 as a function of proliferation (CPD expression) after 4 days of stimulation shown in flow cytometry plots (left) and graph with frequencies of infant (red) and adult (blue) T cells that downregulated TCF-1 (right). (C) (left) Proliferation of infant (red) and adult (blue) T cells upon varying dose of anti-CD3 stimulation shown in representative flow cytometry plots of proliferation dye dilution (left) and graph showing proliferation index from each independent experiment (right). (D) Expression of TCF-1 by infant and adult T cells following anti-CD3 stimulation (1 μg) as a function CPD dilution in representative flow cytometry dot plots (top row) and histograms of TCF-1 expression by infant (red) and adult (blue) T cells in non-dividing cells (division 0, top row)) and cells undergoing 3-5 divisions (bottom row). (E) Graph showing percent TCFlow cells (i.e.—TCF-1 downregulated cells) for infant (red) and adult (blue) T cells at indicated divisions for each of three independent experiments. Statistical analysis was done using Student’s paired t-test (*p<0.05) with error bars representing S.E.M.

