. 2022 Jan 18;11:e72072. doi: 10.7554/eLife.72072

Figure 1. Diversity for floral ultraviolet (UV) pigmentation patterns in wild sunflowers.

(a) Geographical distribution of sampled populations for H. annuus and (b) H. petiolaris. Yellow/orange dots represent different populations, overlaid grey dot size is proportional to the population mean ligule ultraviolet proportion (LUVp). (c) Range of variation for floral UV pigmentation patterns in the two species. Scale bar = 2 cm. (d) LUVp values distribution for H. annuus and (e) H. petiolaris subspecies.
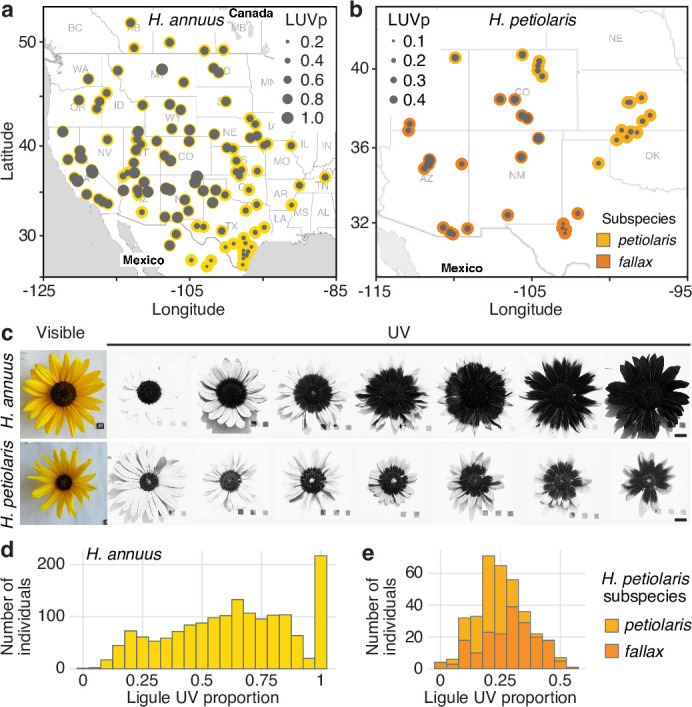
Figure 1—source data 1. Populations used in this study, average ligule ultraviolet proportion (LUVp) values, environmental variables, and inflorescence traits.
Figure 1—source data 2. Individuals used in this study, ligule ultraviolet proportion (LUVp) values, Chr15_LUVp SNP genotypes, and inflorescence traits.
elife-72072-fig1-data2.xlsx (248.9KB, xlsx)

Figure 1.

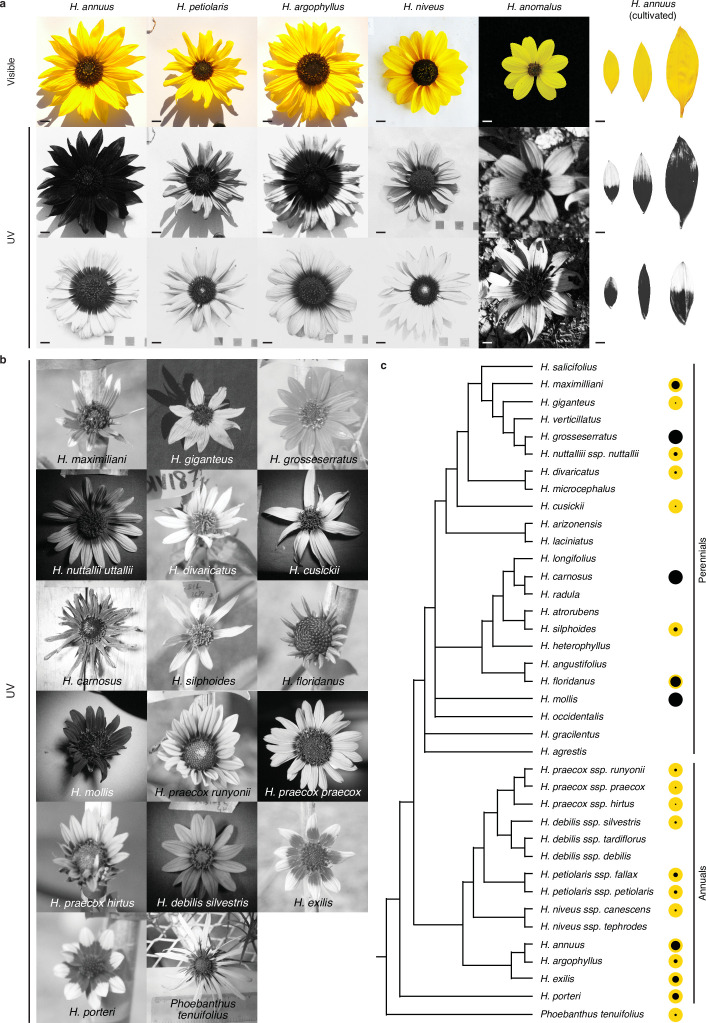
Figure 1—figure supplement 1. Floral ultraviolet (UV) patterns in wild sunflower species and cultivated sunflower.

Figure 1—figure supplement 1.

(a) Visible and UV images of inflorescences from five wild sunflower species, and ligules of six cultivated sunflower lines. Variation in floral UV patterns was found within all these species. Scale bar = 1 cm. (b) UV images of inflorescences from 16 wild sunflower (sub-)species and for the outgroup Phoebanthus tenuifolius. Images are not to scale. (c) Species tree for 31 annual and perennial sunflower species and P. tenuifolius, adapted from Figure 1 Stephens et al., 2015. The size of the black dot to the right of each species name is proportional to the average size of bullseye patterns measured for that species or subspecies (Figure 1—source data 1). For the species in (a), excluding H. anomalus, bullseye values are averages for ≥42 individuals (see also Figure 1—figure supplement 3). For H. anomalusthe species in (b), bullseye values are for single individuals or averages for up to three individuals. Two taxa in the original species tree, H. petiolaris and H. neglectus, were renamed to H. petiolaris ssp. petiolaris and H. petiolaris ssp. fallax to reflect the current understanding of their identities.
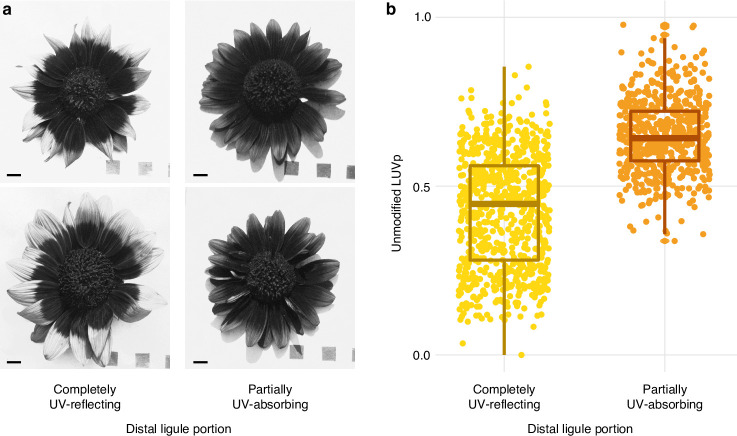
Figure 1—figure supplement 2. Partial ultraviolet (UV) absorbance in the distal part of ligules in H. annuus.

Figure 1—figure supplement 2.

(a) The distal part of ligules displays partial levels of UV absorbance in ~46% of H. annuus individuals (excluding individuals that have completely UV-absorbing ligules). Scale bar = 1 cm. (b) Partial UV absorbance in the distal part of ligules is more common in individuals with larger (unmodified) ligule ultraviolet proportion (LUVp). Difference is significant for p=1.72 × 10–117 (Mann–Whitney U-tests, W = 401818, two-sided; completely UV-reflecting: n = 760 individuals; partially UV-absorbing: n = 614 individuals). Boxplots show the median, box edges represent the 25th and 75th percentiles, whiskers represent the maximum/minimum data points within 1.5× interquartile range outside box edges. The presence of this partial UV absorbance was incorporated in the LUVp values used for genome-wide association studies (GWAS) (see ‘Ultraviolet and infrared photography’); while this improved the strength of the association with the Chr15_LUVp SNP in GWAS (from p=8.52e–19 to p=5.81e–25), it did not change the overall pattern. Similarly, ignoring UV absorbance in the tip of ligules had only a minor effect on the average LUVp values for genotypic classes at the Chr15_LUVp SNP (Figure 1—source data 2).
Figure 1—figure supplement 3. Ligule ultraviolet proportion (LUVp) variation in wild sunflower species and cultivated sunflower.
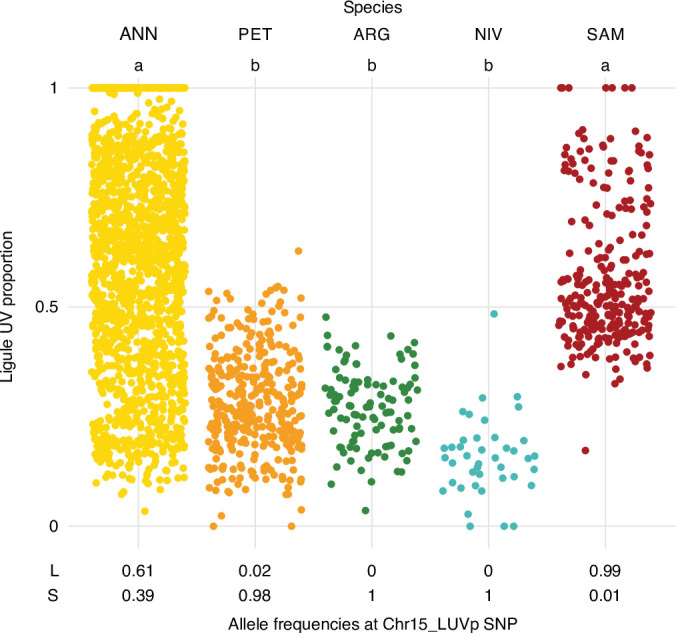
Figure 1—figure supplement 3.

LUVp values for individuals of four wild sunflower species and of the cultivated sunflower association mapping (SAM) population, and allele frequencies at the Chr15_LUVp SNP. ANN, wild H. annuus (n = 1589 from 110 populations); PET, H. petiolaris (n = 351 individuals from 40 populations); ARG, H. argophyllus (n = 105 individuals from 27 populations); NIV, H. niveus (n = 42 individuals from nine populations); SAM, cultivated H. annuus (n = 275 individuals). Letters identify groups that are significantly different for p<0.001 (one-way ANOVA with post-hoc Tukey HSD test, F = 247, df = 4). Exact p-values for pairwise comparisons are reported in Figure 1—source data 2.