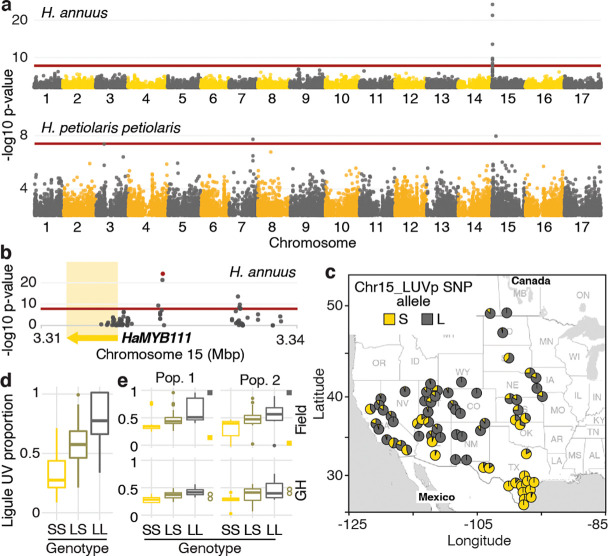
Figure 2. A single locus explains most of the variation in floral ultraviolet (UV) patterning in H. annuus.
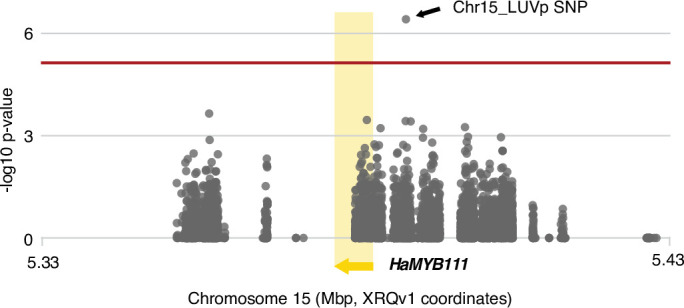
(a) Ligule ultraviolet proportion (LUVp) genome-wide association studies (GWAS). (b) Zoomed-in Manhattan plot for the chromosome 15 LUVp peak in H. annuus. Red lines represent 5% Bonferroni-corrected significance. GWAS were calculated using two-sided mixed models. Number of individuals: n = 563 individuals (H. annuus); n = 159 individuals (H. petiolaris petiolaris). Only positions with -log10 p-value >2 are plotted. HaMYB111 is the only annotated feature in the genomic interval shown in Figure 1b; the single-nucleotide polymorphism (SNP) with the strongest association to LUVp (Chr15_LUVp SNP) is highlighted in red. Linkage disequilibrium (LD) decays rapidly in wild H. annuus (average R2 at 10 kbp is ~0.035; Todesco et al., 2020), and all SNPs significantly associated with LUVp in H. annuus are included in the depicted region. The chromosome 15 association in H. petiolaris petiolaris is distinct from the one in H. annuus as it is located ~20 Mbp downstream of HaMYB111. (c) Geographical distribution of Chr15_LUVp SNP allele frequencies in H. annuus. L, large; S, small allele. (d) LUVp associated with different genotypes at Chr15_LUVp SNP in natural populations of H. annuus grown in a common garden. All pairwise comparisons are significant for p<10–16 (one-way ANOVA with post-hoc Tukey HSD test, F = 438, df = 2; n = 563 individuals). LUVp values for the individuals in the GWAS populations and genotype data for Chr15_LUVp SNP are reported in Figure 1—source data 2. (e) LUVp associated with different genotypes at Chr15_LUVp SNP in H. annuus F2 populations grown in the field or in a greenhouse (GH). Measurements for the parental generations are shown: squares, grandparents (field-grown); empty circles, F1 parents (GH-grown; Figure 2—figure supplement 2). Boxplots show the median, box edges represent the 25th and 75th percentiles, whiskers represent the maximum/minimum data points within 1.5× interquartile range outside box edges. Differences between genotypic groups are significant for p=0.0057 (Pop. 1 Field, one-way ANOVA, F = 5.73, df = 2; n = 54 individuals); p=0.0021 (Pop. 2 Field, one-way ANOVA, F = 7.02, df = 2; n = 50 individuals); p=0.00015 (Pop. 1 GH, one-way ANOVA, F = 11.13, df = 2; n = 42 individuals); p=0.054 (Pop. 2 GH, one-way ANOVA, F = 3.17, df = 2; n = 38 individuals). p-Values for pairwise comparisons for panels (d) and (e) are reported in Figure 2—source data 1.
Figure 2—figure supplement 1. Ligule ultraviolet proportion (LUVp) genome-wide association study (GWAS) in H. petiolaris fallax (n = 193 individuals).
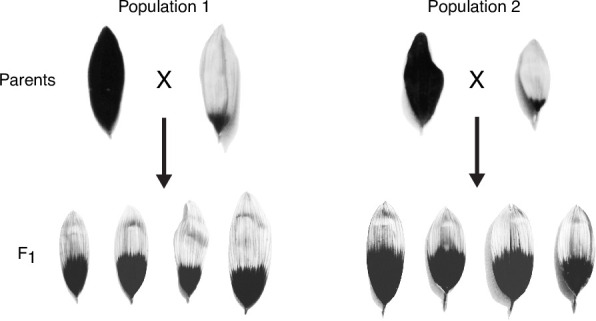
Figure 2—figure supplement 2. Floral ultraviolet (UV) patterns in the parental lines of F2 populations.

Figure 2—figure supplement 3. Ligule ultraviolet proportion (LUVp) genome-wide association study (GWAS) in unfiltered H. annuus datasets.


