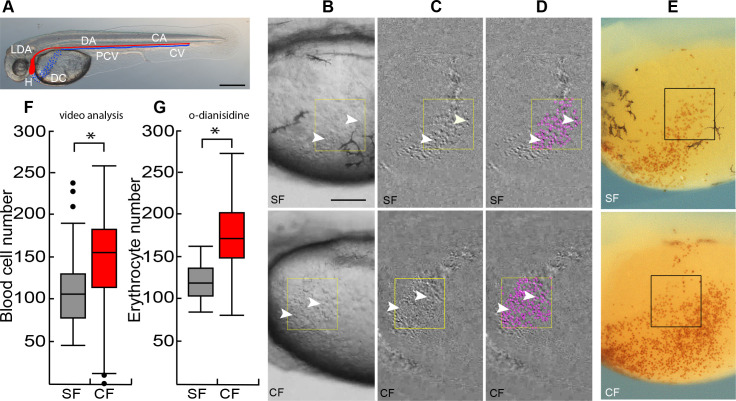
Figure 1. Cavefish have more erythrocytes than surface fish.
(A) At 36 hpf blood circulates from the heart (H) through the lateral dorsal aorta (LDA), the dorsal aorta (DA) and caudal artery (CA) (blood flow shown in red), and back to the heart through the caudal vein (CV), the posterior cardinal vein (PCV), and the Duct of Cuvier (DC) (blood flow shown in blue). Scale bar is 200 µm. (B–D). Video analysis of circulating blood cells (arrowheads) in a region of interest (ROI, boxes) in the DC of surface fish (SF) and cavefish (CF) larvae at 36 hpf visualized by subtraction of two video frames 0.15 s apart (C, D) and quantified using the plugin TrackMate (ImageJ) (D, purple dots). (E) o-dianisidine staining of red blood cells in the DC of surface fish (SF) and cavefish (CF) larvae at 36 hpf. Boxes: erythrocyte quantification regions. Scale bar in E is 100 µm, B-E are the same magnifications. (F, G). Quantification of blood cells in the DC by video analysis (F) and o-dianisidine staining. Box plots show the median, quartiles, min-max values and outliers (dots). Asterisks: p < 0.05, N = 72 (in F) and p < 0.0001, N = 36 (in G). Statistics by Wilcoxon/Kruskal-Wallis Rank Sums test.

