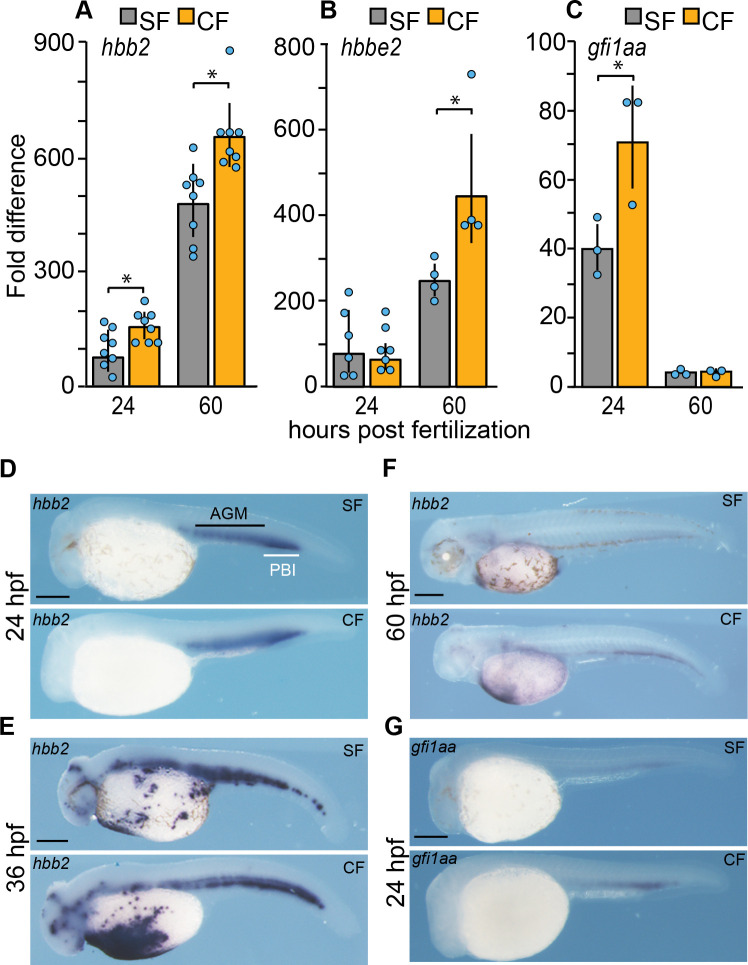
Figure 2. Expression of hematopoietic genes during surface fish and cavefish development.
(A–C). qPCR quantification of hhb2, hbbe2, and gfi1aa transcripts in surface fish (SF) and cavefish (CF) larvae at 24 hpf and 60 hpf. Error bars: range of fold change. Asterisks: (A) N = 8. p = 0.0045 for SF vs CF at 24 hpf and p = 0.0254 for SF vs CF at 60 hpf; (B) N = 4. p = 0.0271 for SF vs CF at 60 hpf.; (C) N = 3. p = 0.0413 for SF vs CF at 24 hpf. Statistics by two-way ANOVA followed by Student’s t test. (D–G). In situ hybridizations showing hbb2 staining at 24, 36, and 60 hpf, (D–F) and gfi1aa staining (G) at 24 hpf in CF and SF. AGM: aorta-gonad-mesonephros. PBI: posterior blood island. Scale bars are 200 µm in each frame. Magnifications are the same in SF and CF.

