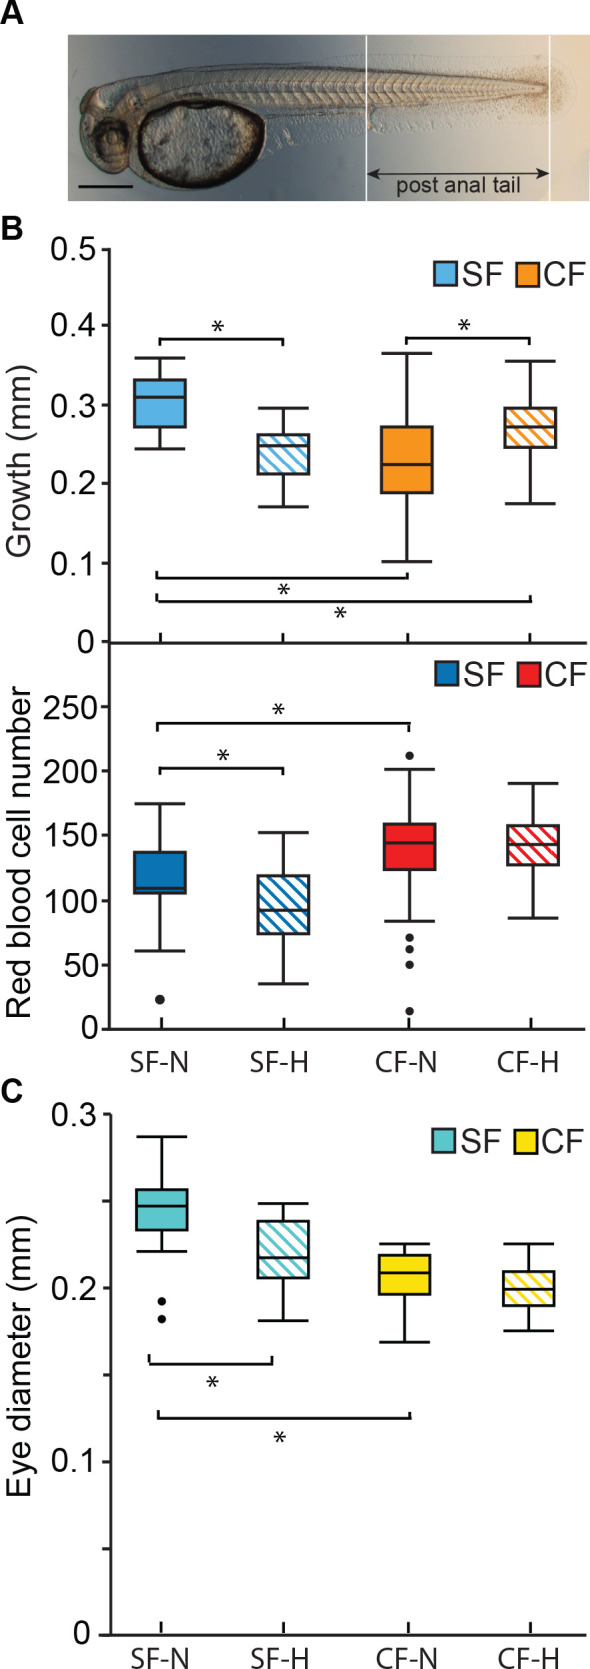
Figure 6. Effects of laboratory induced hypoxia on surface fish and cavefish growth.

(A). Image of a 36 hpf surface fish larval showing post-anal tail length. Scale Bar is 200 µM. (B). Relative post-anal tail growth (top) and erythrocyte numbers (bottom) of surface fish and cavefish over an 18 hr. period under normoxic and hypoxic (1 mg/L oxygen) conditions. Top frame asterisks from left to right: p < 0.0001, p = 0.002; p < 0.0001, and p = 0.0021. N = 23 for SF-N and SF-H. N = 46 for CF-N. N = 47 for CF-H. Statistics by Wilcoxon/Kruskal-Wallis Rank Sums test followed by Wilcoxon for each pair. Middle frame asterisks from left to right: p = 0.0116, and p = 0.0078. N = 22 for SF-N. N = 21 for SF-H. N = 47 for CF-N, and N = 45 for CF-H. Statistics by one-way ANOVA followed by Student’s t-test. (C) Difference in eye diameters in surface fish and cavefish after 18 hr. of hypoxia or normoxia. Bottom frame asterisks: p = 0.0002 and p < 0.0001. N = 18 for SF-N. N = 14 for SF-H. N = 30 for CF-N. N = 28 for CF-H. Statistics by one-way ANOVA followed by Student’s t-test. Box plots show median, quartiles and min-max values.
