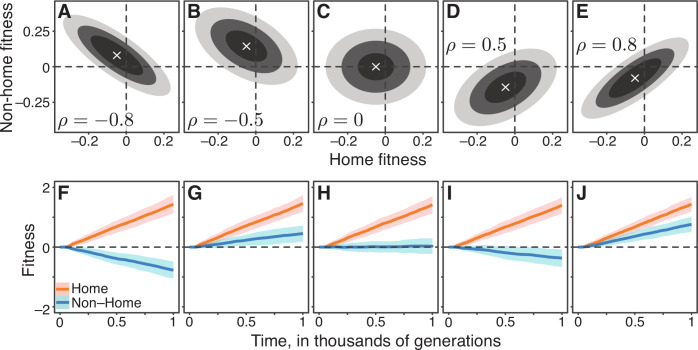
Figure 2. Gaussian JDFEs and the resulting fitness trajectories.
(A–E) Contour lines for five Gaussian JDFEs. ‘‘x’’ marks the mean. For all distributions, the standard deviation is 0.1 in both home- and non-home environments. The correlation coefficient ρ is shown in each panel. (F–J) Home and non-home fitness trajectories for the JDFEs shown in the corresponding panels above. Thick lines show the mean, ribbons show ±1 standard deviation estimated from 100 replicate simulations. Population size , mutation rate ().


