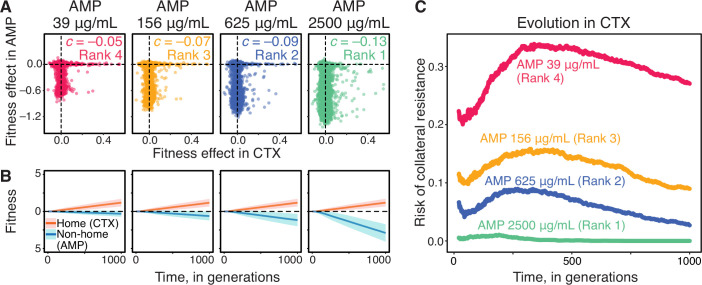
Figure 4. Robust ranking of drug pairs.
(A) Four hypothetical JDFEs, ranked by their statistic. For all four JDFEs, the mean and the standard deviation in the home environment are and , respectively. The mean and the standard deviation in the non-home environment are and (rank 1), and (rank 2), and (rank 3), and (rank 4). Correlation coefficient for all four JDFEs is . (B) Collateral resistance risk over time, measured as the fraction of populations with positive mean fitness in the non-home environment. These fractions are estimated from 1000 replicate Wright-Fisher simulation runs with , (). Colors correspond to the JDFEs in panel A. Numbers indicate the -rank of each JDFE. (C) A priori -rank (-axis) versus the a posteriori rank (-axis) based on the risk of collateral resistance observed in simulations, for all 125 Gaussian JDFEs and all values shown in Figure 3. Gray dashed line is the identity line. values are and for and , respectively. for all regressions.


