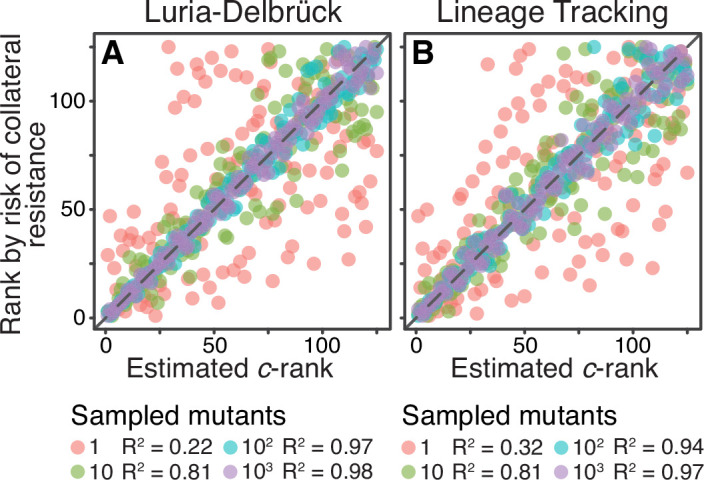
Figure 5. Sampling effects on the ranking of drug pairs.
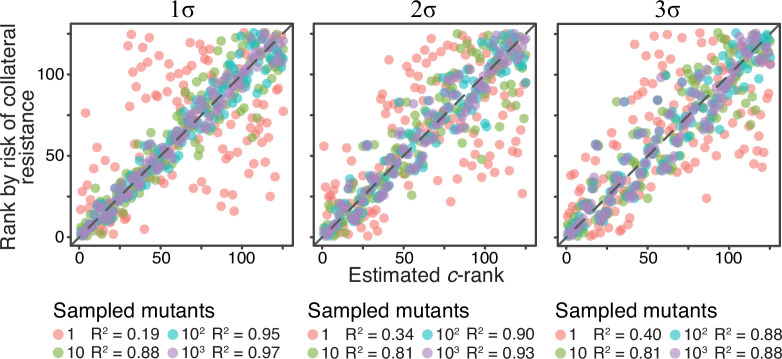
Both panels show correlations between the a priori estimated -rank (-axis) of the 125 Gaussian JDFEs and their a posteriori rank (-axis) based on the risk of collateral resistance observed in simulations (same data as the -axis in Figure 4C for ). (A) The statistic is estimated using the Luria-Delbrück method (see text for details). Cutoff for sampling mutations is , where σ is the standard deviation of the JDFE in the home environment. See Figure 5—figure supplement 1 for other cutoff values. (B) The statistic is estimated using the barcode lineage tracking method with and (see text and Materials and methods for details). for all regressions.


