. 2022 Jan 5;11:e72867. doi: 10.7554/eLife.72867

Figure 1. Type I PRMTs and PRMT5 inversely regulate intron retention.

(a) Overview of protein arginine methyltransferases and their catalyzed reactions. (b) Comparison of ΔΨ for retained introns (RI) following PRMT inhibition where ΔΨ=Ψ (PRMT inhibitor)–Ψ (DMSO). Significance determined using Kolmogorov-Smirnov test; *<0.05, ****<0.0001, ns=not significant. (c) Comparison of ΔΨ z-score for common RI after 2-day treatment with PRMT inhibitors. (d) Genome browser track of poly(A)-RNA seq aligned reads for GAS5, ANKZF1, and NOP2. Yellow shading denotes RI. Scale (0.1 kb) indicated in lower right corner. (e) RT-qPCR of RI highlighted in panel (d). Data are represented as mean ± SD. (f, g) Comparison of RI and A549-expressed intron distance to the transcription-end site (TES) (f) or intron length (g) in log10(kb). Dashed line indicates genomic median; solid line within boxplot is condition-specific median. Significance determined using Wilcoxon rank-sum test; ****<0.0001.

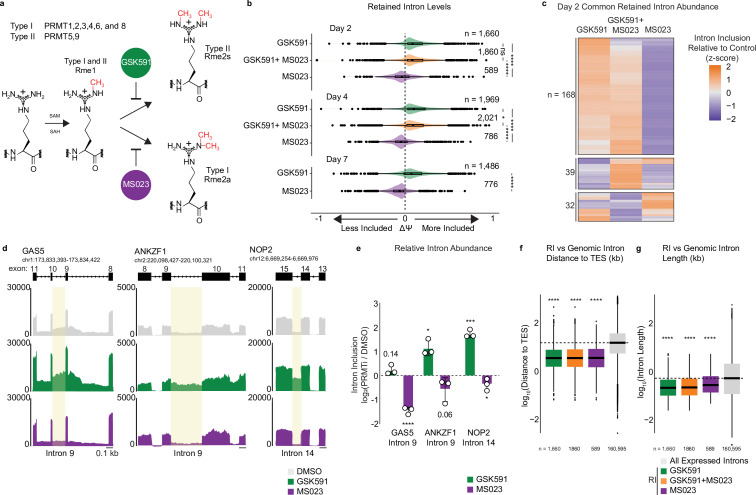
Figure 1.

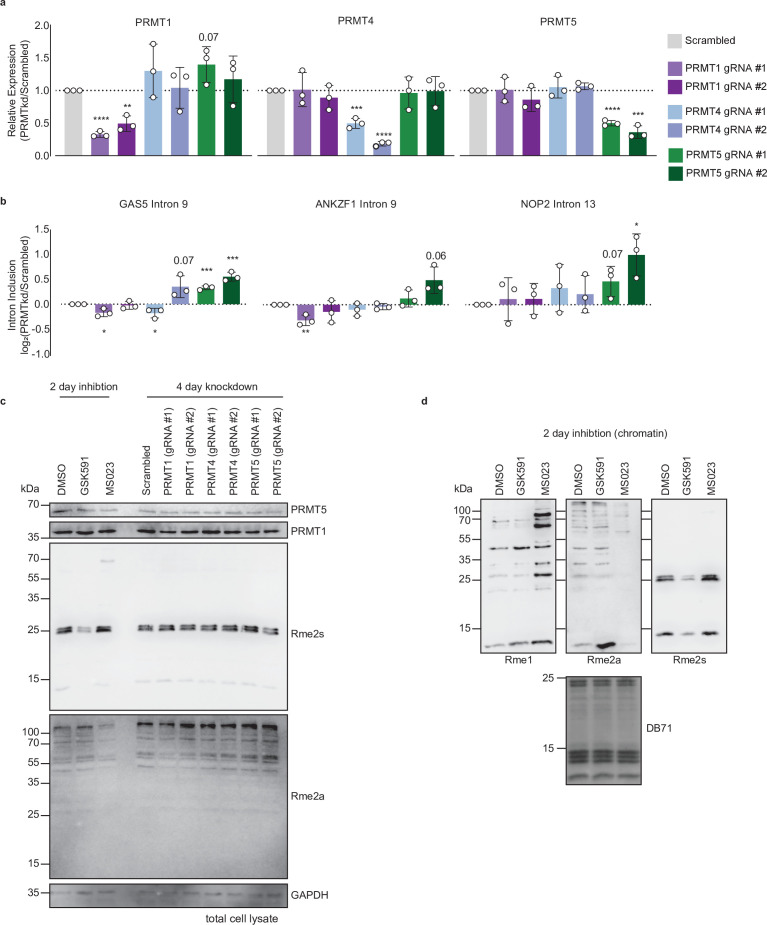
Figure 1—figure supplement 1. PRMTkd recapitulates RI inclusion seen with PRMT inhibition.

Figure 1—figure supplement 1.

(a, b) RT-qPCR of PRMT expression (a) or RI (b) 4 days after transduction of A549 cells with gRNAs targeting the indicated PRMT. Data are represented as mean ± SD. Significance determined using Student’s t-test; *<0.05, **<0.01, ***<0.001, ****<0.0001. (c) Western blot of total cell extract following 2-day treatment with DMSO, GSK591, or MS023 or 4-day knockdown of indicated PRMTs. See Figure 1—figure supplement 1—source data 1. (d) Western blot of chromatin following 2-day treatment with DMSO, GSK591, or MS023. DB71=Direct Blue 71 membrane stain. See Figure 1—figure supplement 1—source data 2.
Figure 1—figure supplement 1—source data 1. Western blot data for Figure 1—figure supplement 1c.
Figure 1—figure supplement 1—source data 2. Western blot data for Figure 1—figure supplement 1d.
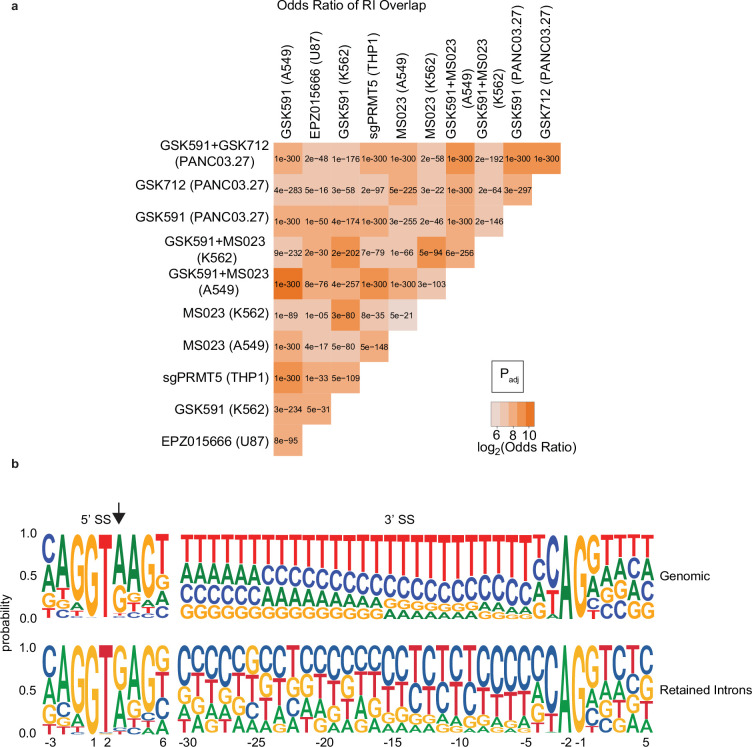
Figure 1—figure supplement 2. PRMTs regulate a conserved class of retained introns (RI) that share unique features.

Figure 1—figure supplement 2.

(a) Matrix comparing the log2(odds ratio) and significance as determined by the Fisher’s exact test of overlapping RI from indicated experimental models. (b) Web logo diagram of nucleotide distribution probability of A549 expressed or RI.