. 2022 Jan 5;11:e72867. doi: 10.7554/eLife.72867

Figure 2. Retained introns (RI) share unique characteristics and are independent of PRMT-regulated co-transcriptional splicing.

(a) Histogram of SKaTER-seq aligned reads across WASL. (b) Distribution of splicing rates for common genomic introns. Dashed line indicates DMSO median; solid line within boxplot is condition-specific median. Significance determined using Wilcoxon rank-sum test; ****<0.0001, ns=not significant. (c) Distribution of splicing rates for common RI as in panel (b). (d–f) Distribution of splicing rates (d), time to transcribe (e), and the probability of cleavage prior to splicing (f) for RI (orange) and A549 expressed introns (dark gray) within the same condition. Dashed line indicates genomic median; solid line within boxplot is condition-specific median. Significance determined using Wilcoxon rank-sum test; *<0.05, **<0.01, ***<0.001, ****<0.0001.

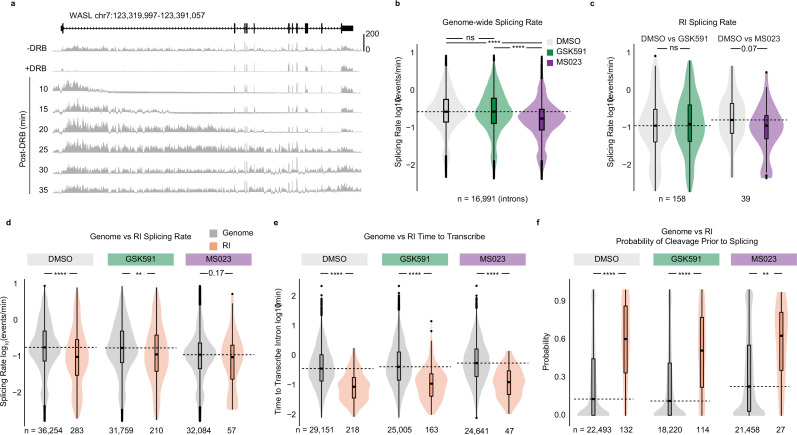
Figure 2.

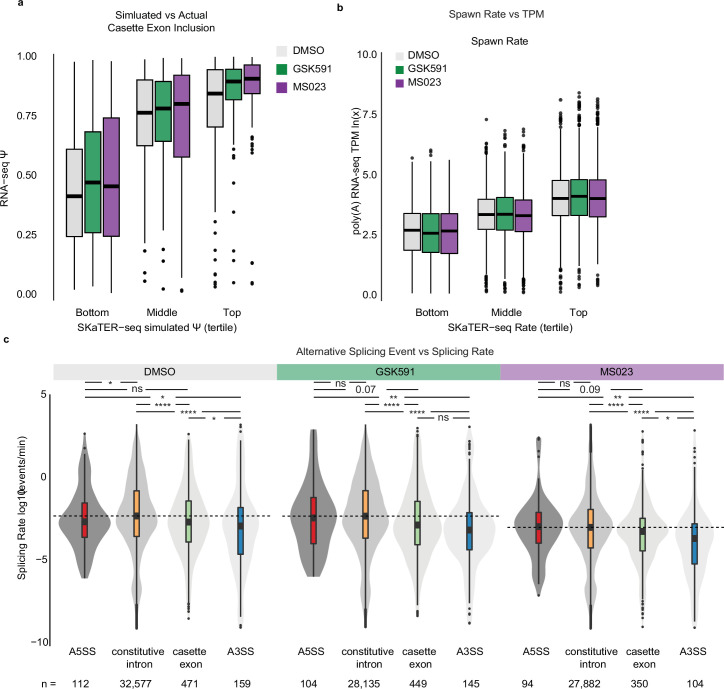
Figure 2—figure supplement 1. Transcript spawn rate correlates with expression and alternative splicing events are slower than constitutive ones.

Figure 2—figure supplement 1.

(a) Correlation of SKaTER-seq model simulated cassette exon Ψ versus poly(A)-RNA seq Ψ. (b) Correlation of RNA pol II initiation and pause-release (spawn rate) with poly(A)-RNA seq transcripts per million (TPM). x-axis is spawn rate in tertiles; y-axis is poly(A)-RNA seq ln(TPM). (c) Distribution of splicing rate versus splicing event as determined by SKaTER-seq modeling. A5SS=alternative 5′ splice site, A3SS=alternative 3′ splice site. Dashed line indicates constitutive intron median; solid line within boxplot is event-specific median. Significance determined using Kolmogorov-Smirnov test; *<0.05, **<0.01, ***<0.001, ****<0.0001, ns=not significant.
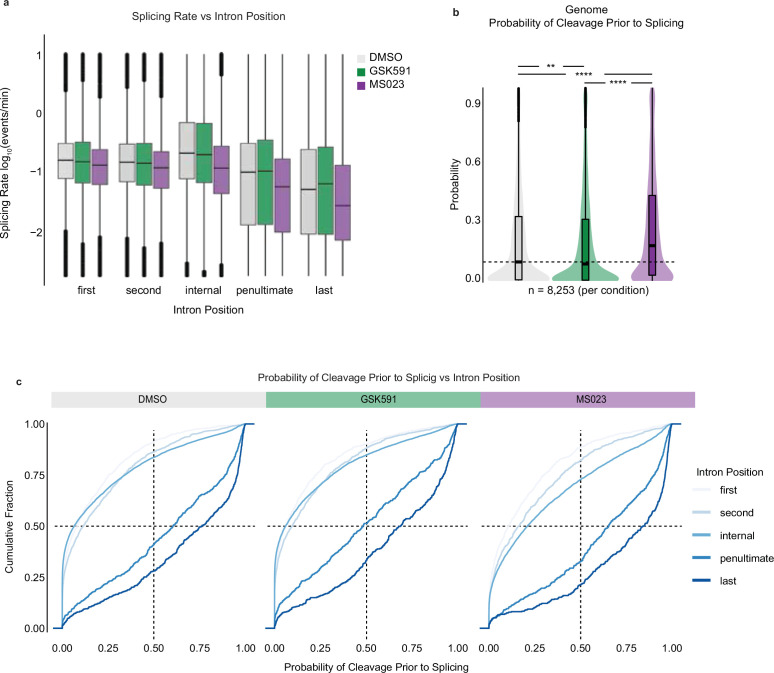
Figure 2—figure supplement 2. Splicing rate and probability of cleavage prior to splicing correlate with intron position.

Figure 2—figure supplement 2.

(a) Correlation of splicing rate and intron position in cells treated with DMSO, GSK591, or MS023 for 2 days. (b) Probability of cleavage prior to splicing for common genome-wide introns relative to DMSO. Dashed line indicates DMSO median; solid line within boxplot is condition-specific median. Significance determined using Wilcoxon rank-sum test; **<0.01, ****<0.0001. (c) Cumulative distribution functions comparing the probability of transcript cleavage prior to intron splicing and intron position. Color range indicates intron position where light blue is closer to transcription start site and dark blue closer to transcription end site.