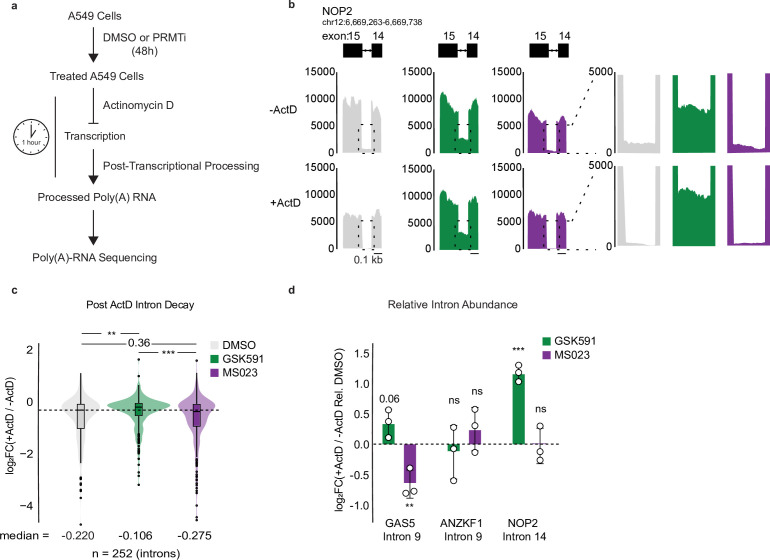
Figure 3. Type I and II PRMTs regulate RI post-transcriptionally.
(a) Overview of Actinomycin D (ActD) poly(A)-RNA sequencing protocol. (b) Genome browser track of poly(A)-RNA seq aligned reads (−) and (+) ActD for NOP2. (c) Distribution of log2(+ActD/−ActD) abundance for common RI between GSK591 and MS023 treated cells relative to DMSO treatment. Dashed line indicates DMSO median; solid line within boxplot is condition-specific median. Significance determined using Wilcoxon rank-sum test; **<0.01, ***<0.001. (d) RT-qPCR of RI (−) and (+) ActD relative to DMSO. Data are represented as mean ± SD. Significance determined using Student’s t-test; **<0.01, ***<0.001, ns=not significant.

